The other day, a Twitter friend asked where New York City neighborhoods begin and end. I forget exactly which NYC agency I got the data from, so I reposted them as a GitHub Gist. Since the Gist does not show neighborhood names, I decided to make a Leaflet map.
Ordinarily, I would makemaps with R, but embedding JavaScript objects in blog posts is no easy task. Instead, I used a Leaflet plugin for WordPress and the resulting map is good enough for these purposes. The best part is that the plugin can read directly from the geojson file hosted in the Gist.
In the map we can clearly see neighborhood boundaries and can click on an area to see the officially designated name. Though it does seem to lump multiple neighborhoods together—such as Hudson Yards, Chelsea, Flatiron and Union Square—probably because the boundaries are disputed.
This map can be helpful the next time you are trying to locate Dowisetrepla.
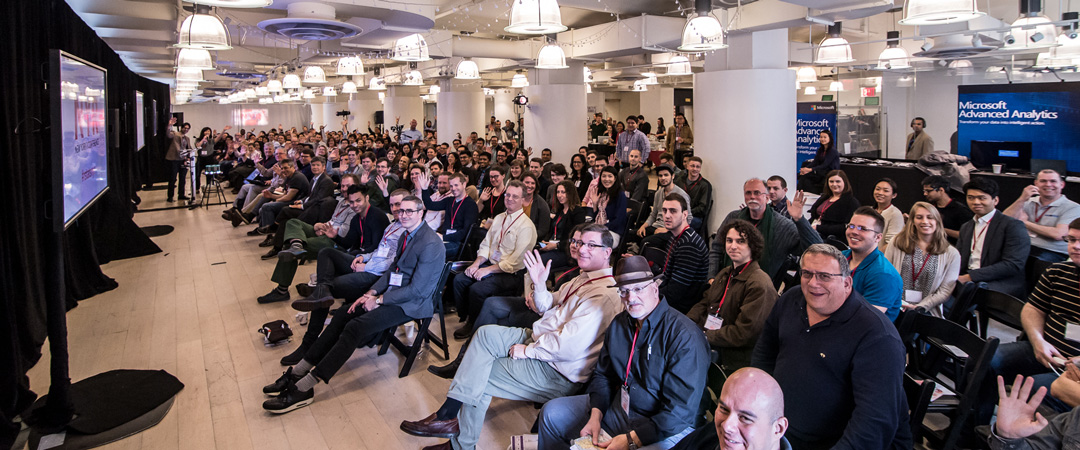
The sixth annual (and first virtual) “New York” R Conference took place August 5-6 & 12-15. Almost 300 attendees, and 30 speakers, plus a stand-up comedian and a whiskey masterclass leader, gathered remotely to explore, share, and inspire ideas.
Let’s take a look at some of the highlights from the conference:
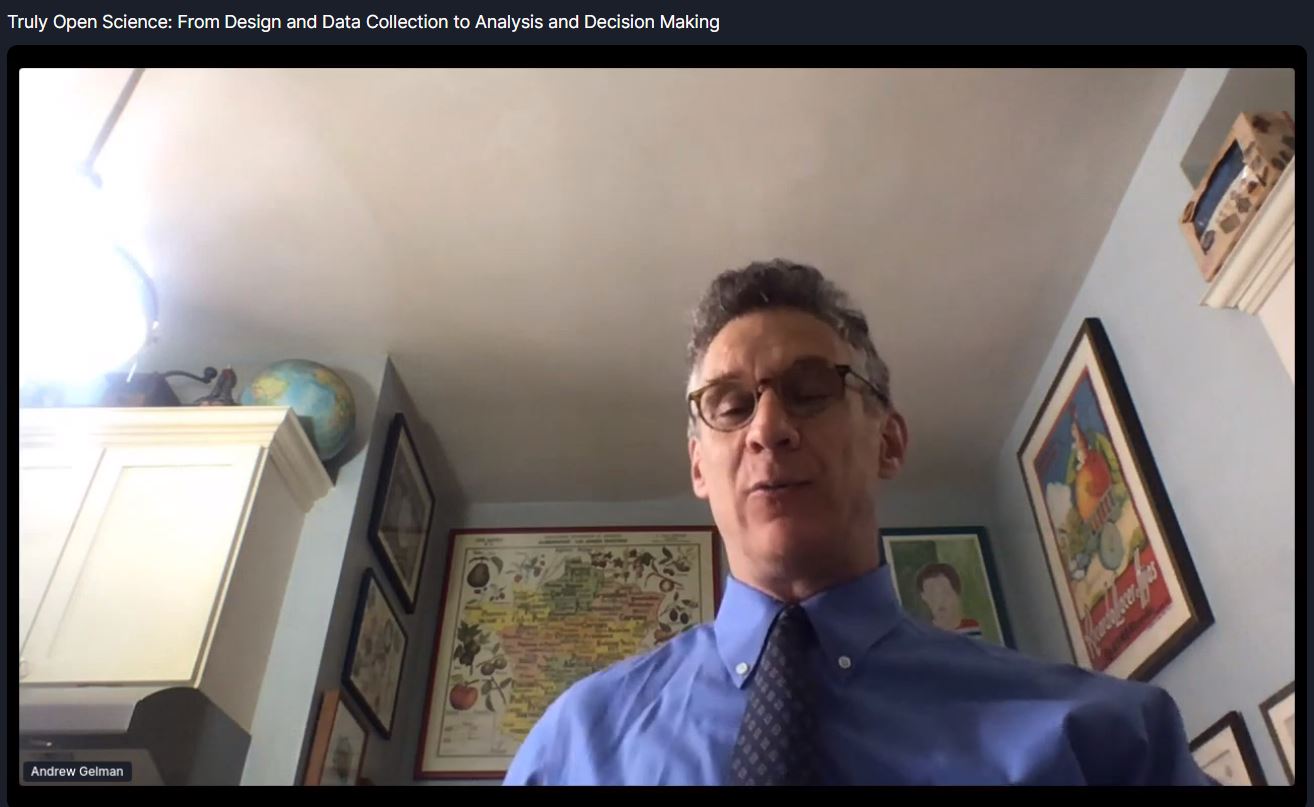
Andrew Gelman Gave Another 40-Minute Talk (no slides, as always)
Our favorite quotes from Andrew Gelman’s talk, Truly Open Science: From Design and Data Collection to Analysis and Decision Making, which had no slides, as usual:
“Everyone training in statistics becomes a teacher.”
“The most important thing you should take away — put multiple graphs on a page.”
“Honesty and transparency are not enough.”
“Bad science doesn’t make someone a bad person.”
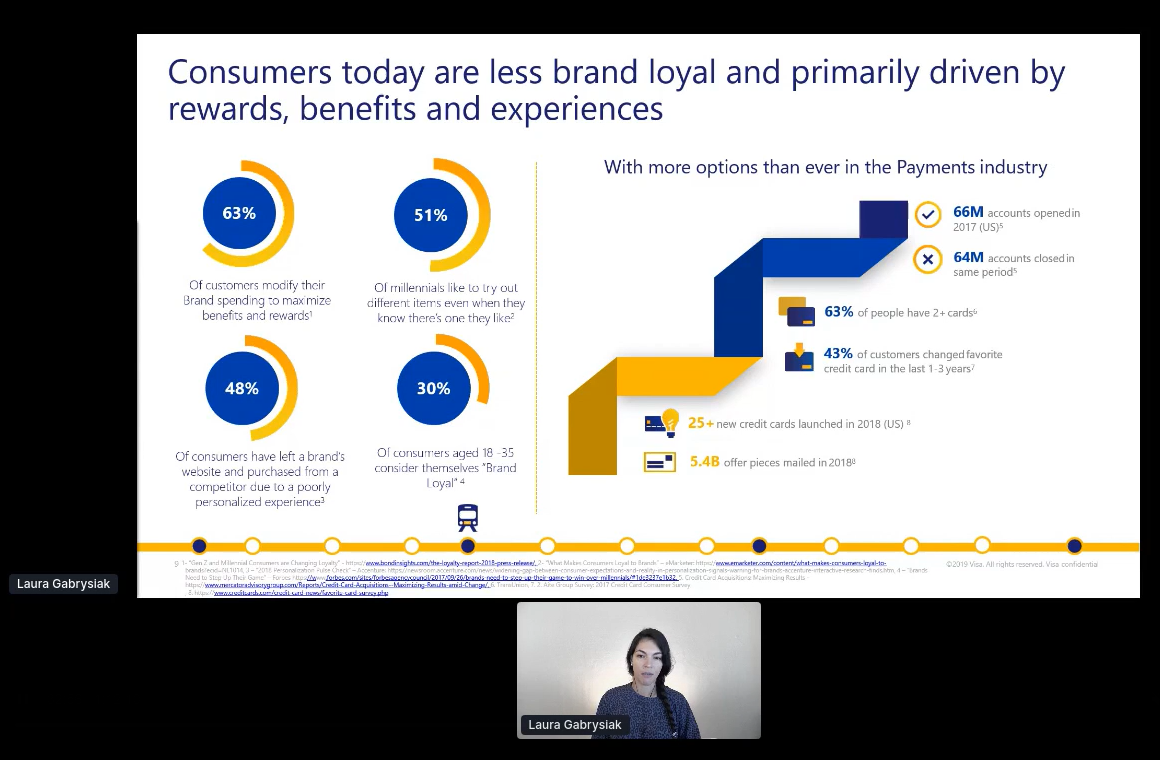
Laura Gabrysiak Shows us We Are Driven By Experience, and not Brand Loyalty…Hope you Folks had a Good Experience!
Laura’s talk on re-Inventing customer engagement with machine learning went through several interesting use cases from her time at Visa. In addition to being a data scientist, she is an active community organizer and the co-founder of R-Ladies Miami.
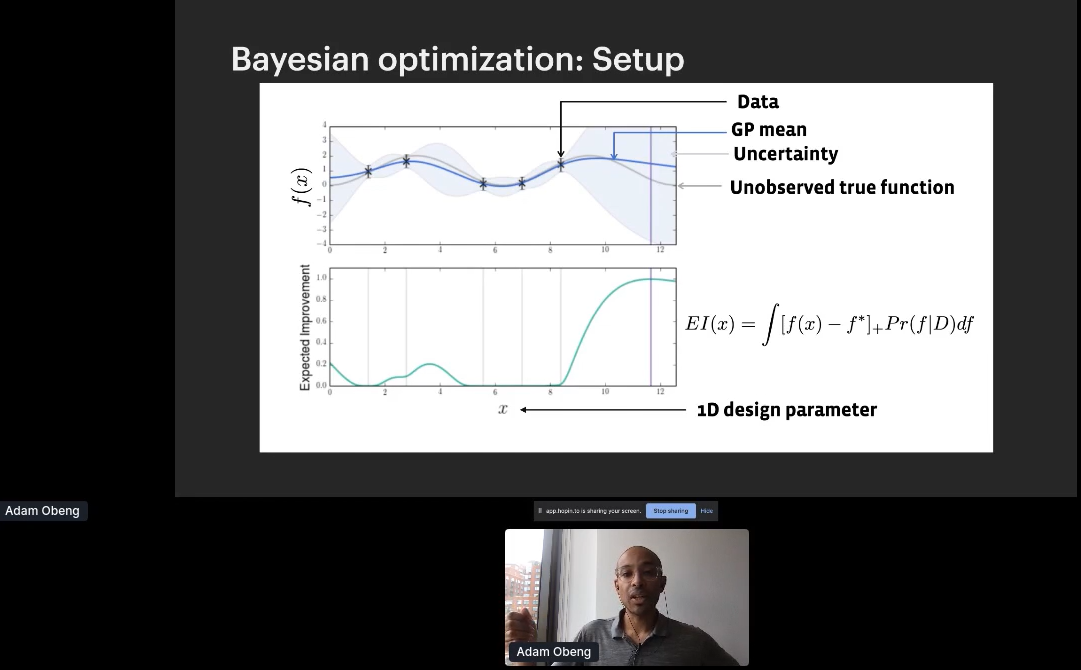
Adam Obeng Delivered a Talk on Adaptive Experimentation
One of my former students at Columbia University, Adam Obeng, gave a great presentation on his adaptive experimentation. We learned that adaptive experimentation is three things: The name of (1) a family of techniques, (2) Adam’s team at Facebook, and (3) an open source package produced by said team. He went through the applications which are hyper-parameter optimization for ML, experimentation with multiple continuous treatments, and physical experiments or manufacturing.
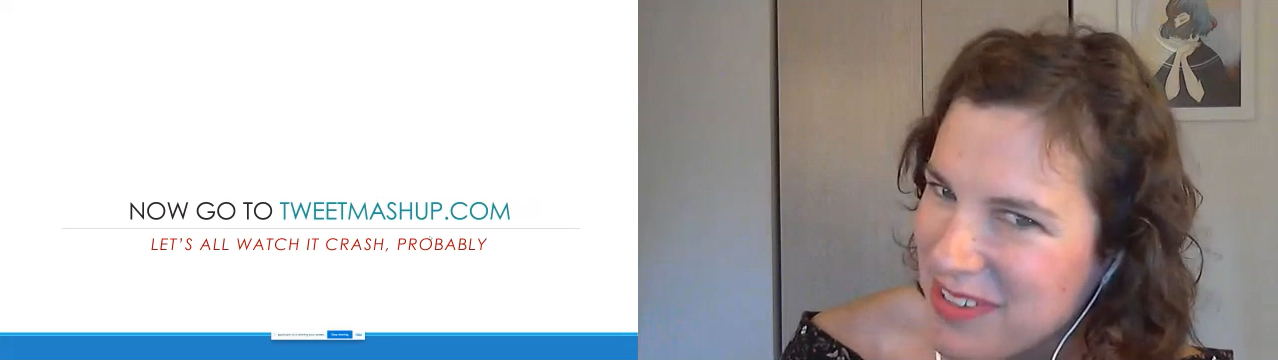
Dr. Jacqueline Nolis Invited Us to Crash Her Viral Website, Tweet Mashup
Jacqueline asked the crowd to crash her viral website,Tweet Mashup, and gave a great talk on her experience building it back in 2016. Her website that lets you combine the tweets of two different people. After spending a year making it in .NET, when she launched the site it became an immediate sensation. Years later, she was getting more and more frustrated maintaining the F# code and decided to see if I could recreate it in Shiny. Doing so would require having Shiny integrate with the Twitter API in ways that hadn’t been done by anyone before, and pushing the Twitter API beyond normal use cases.
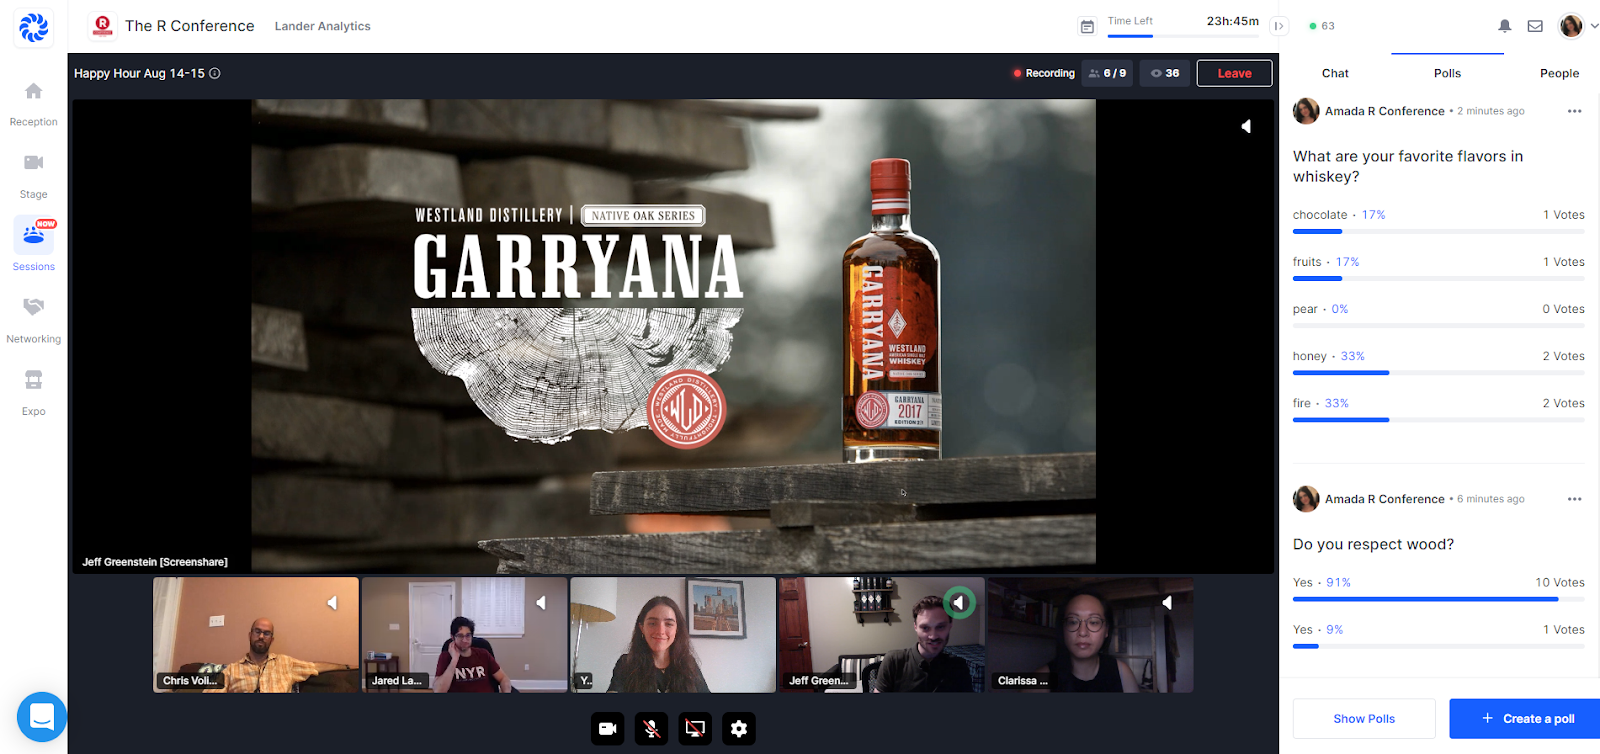
Attendees Participated in Two Virtual Happy Hours Packed with Fun
At the Friday Happy Hour, we had a mathematical standup comedian for the first time in R Conference history. Comic and math major Rachel Lander (no relationship to me!) entertained us with awesome math and stats jokes.
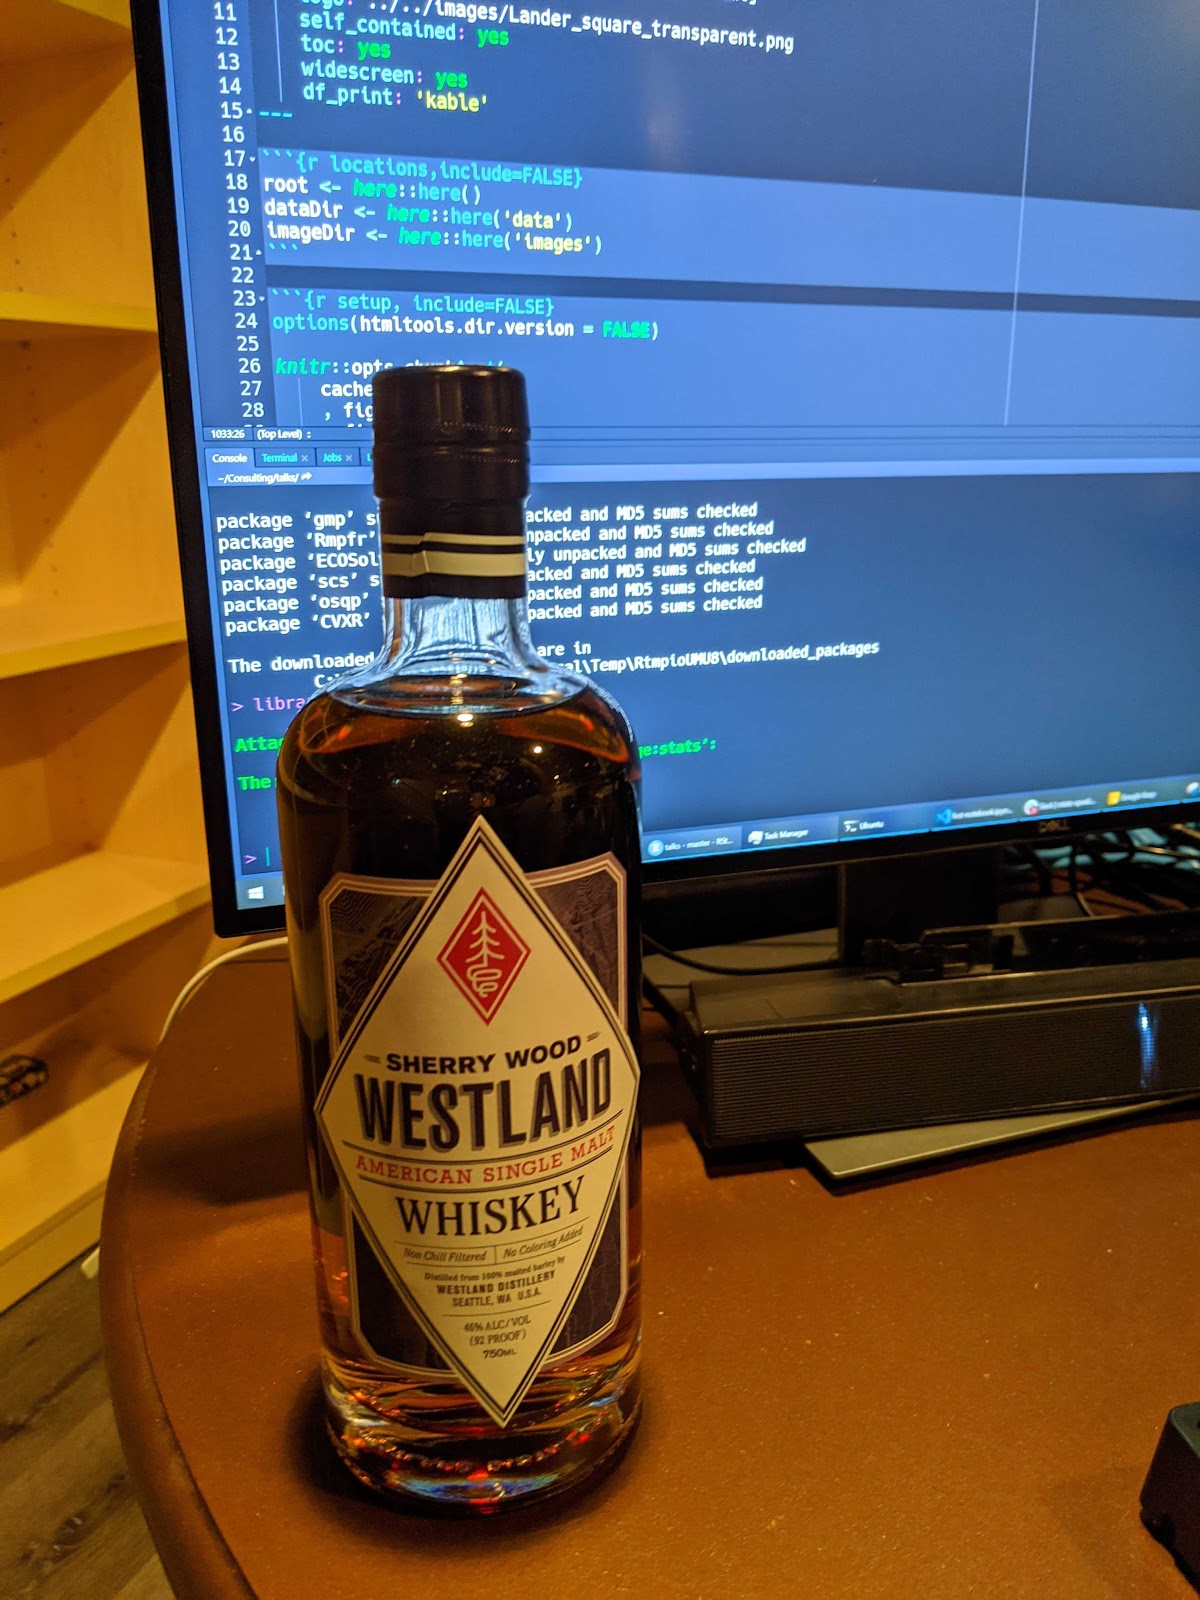
Following the stand up, we had a Whiskey Master Class with our Vibe Sponsor Westland Distillery, and another one on Saturday with Bruichladdich Distillery (hard to pronounce and easy to drink). Attendees and speakers learned and drank together, whether it be their whiskey, matchas, soda or water.
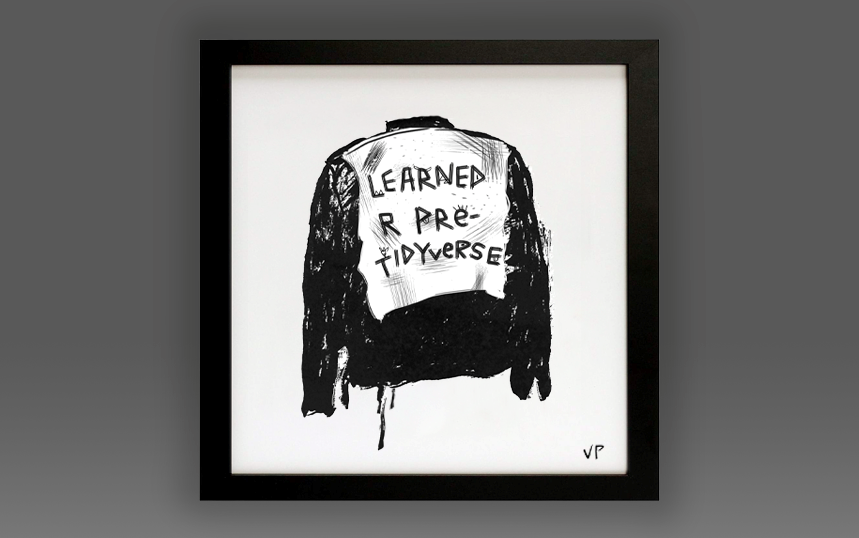
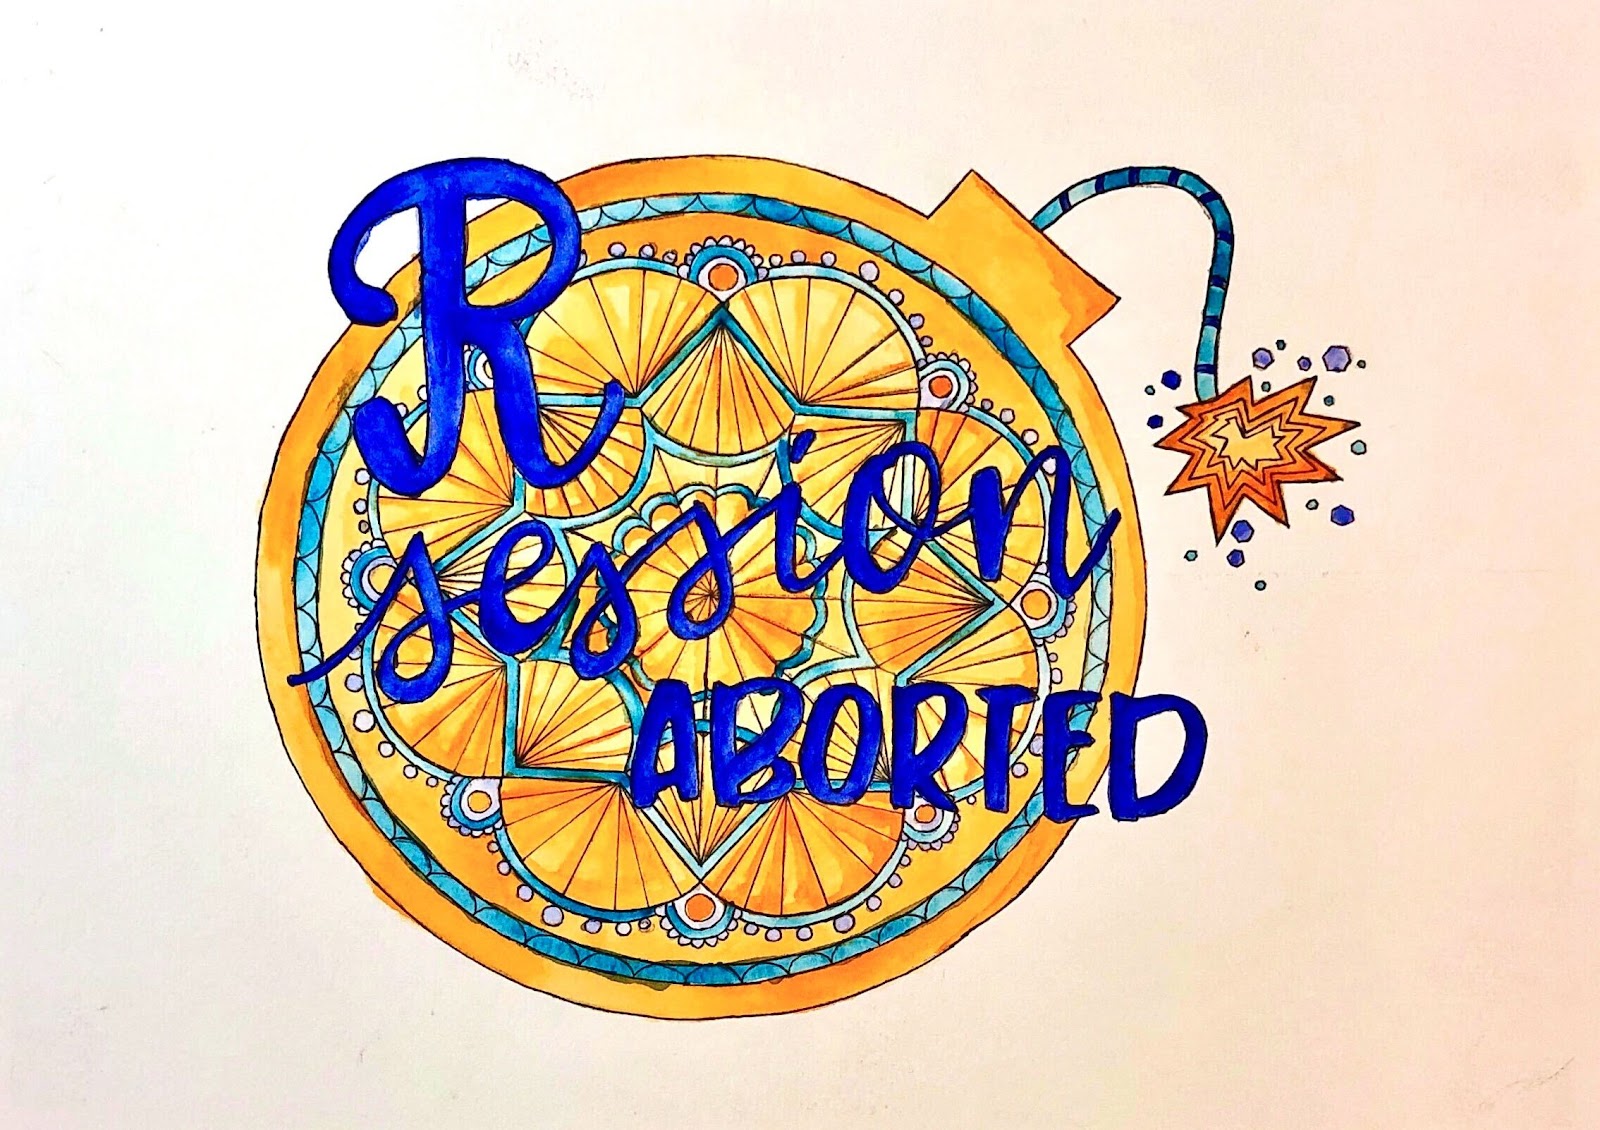
All Proceeds from the A(R)T Auction went to the R Foundation Again
A newer tradition, the A(R)T Auction, took place again! We featured pieces by artists in the R Community, and all proceeds were donated to the R Foundation. The highest-selling piece at auction was Street Cred (2020) by Vivian Peng (Lander Analytics and Los Angeles Mayor’s Office, Innovation Team). The second highest was a piece by Jacqueline Nolis (Brightloom, and Build a Career in Data Science co-author), R Conference speaker, Designed by Allison Horst, artist in residence at RStudio.
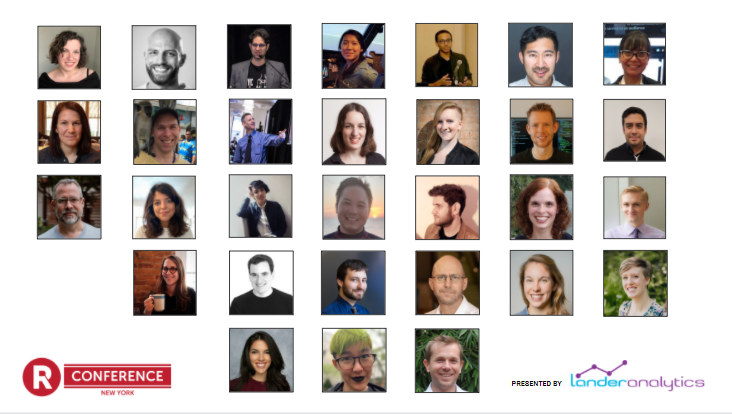
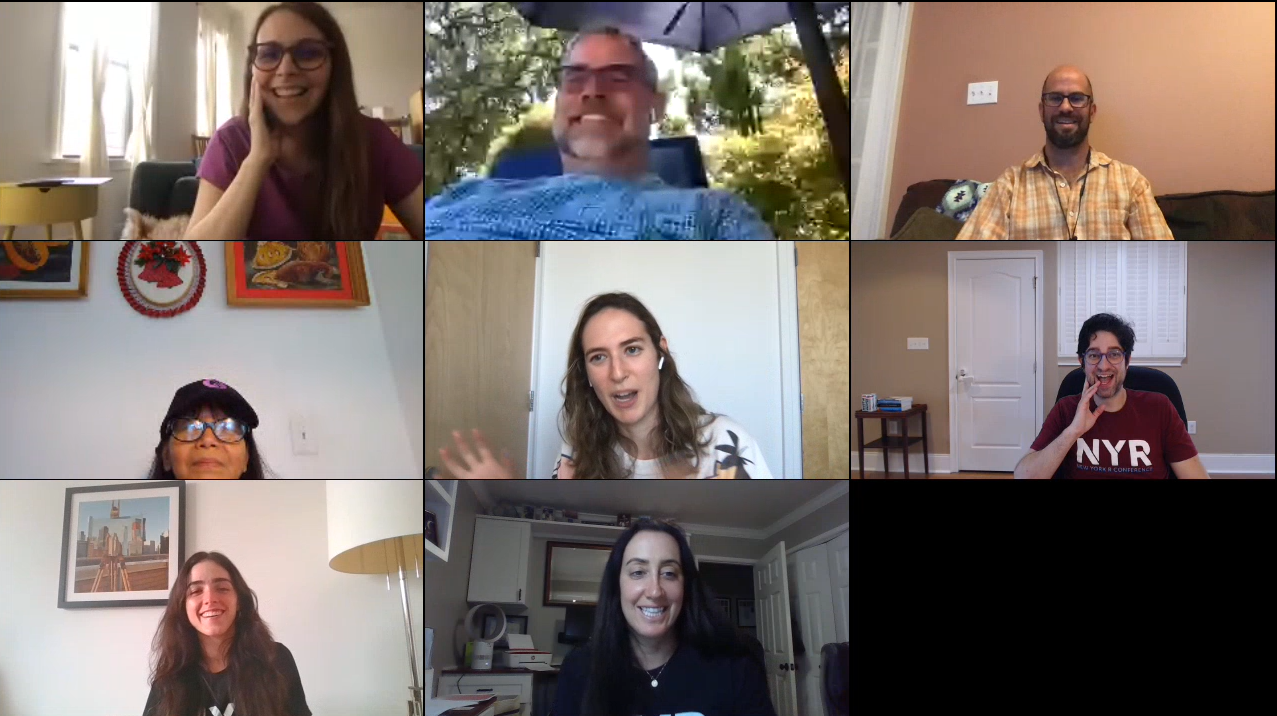
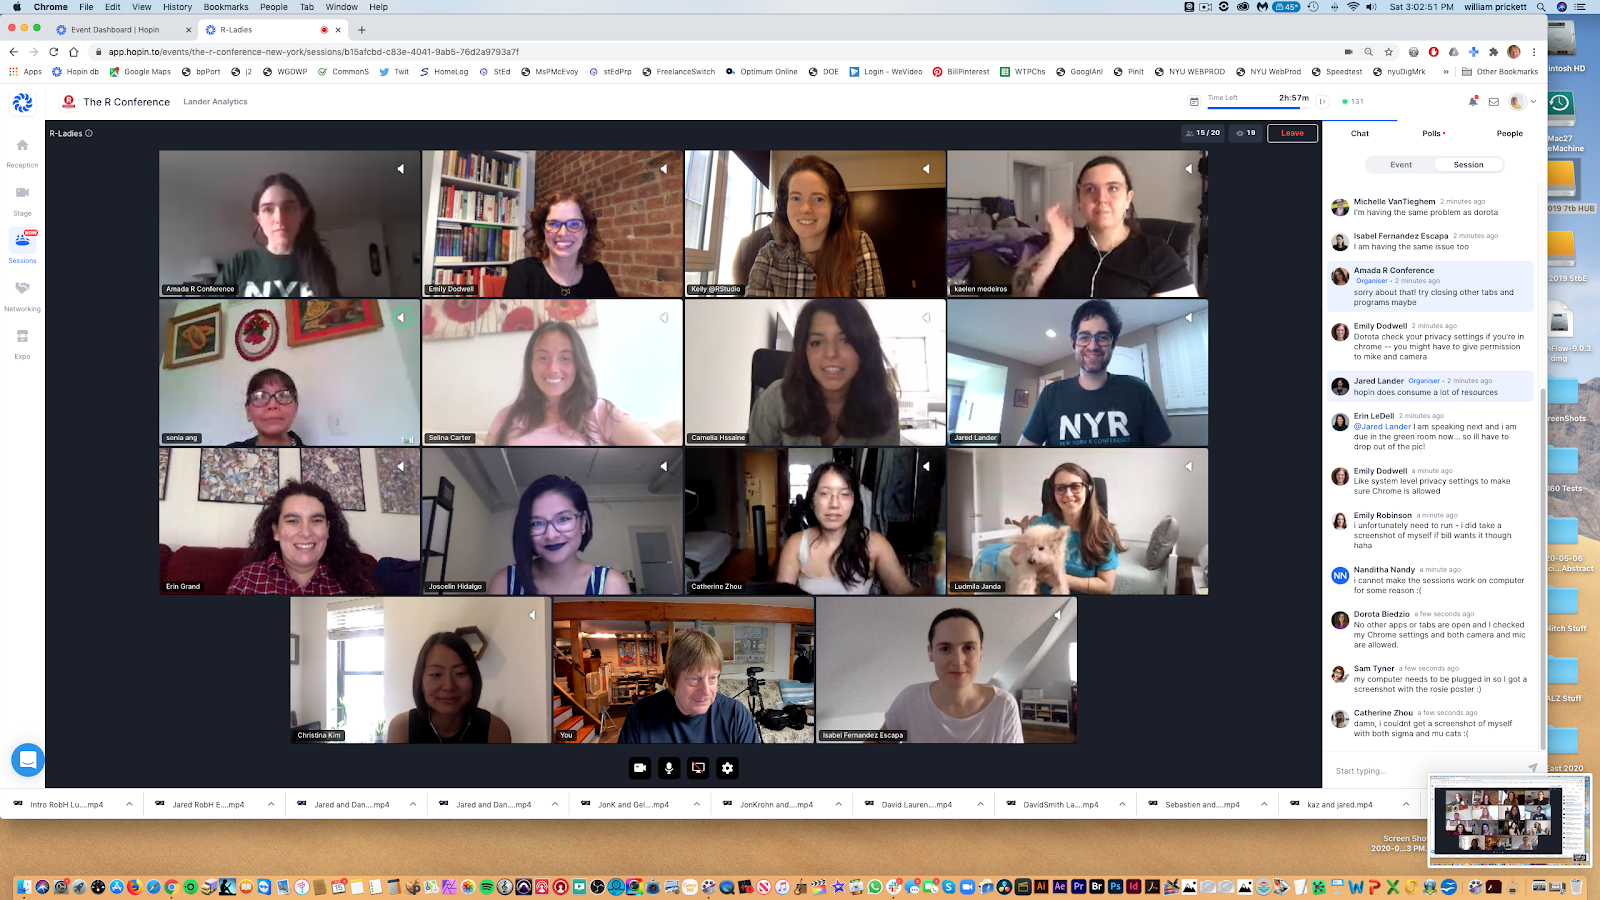
The R-Ladies Group Photo Happened, Even Remotely!
As per tradition, we took an R-Ladies group photo, but, for the first time, remotely– as a screenshot! We would like to note that many more R-Ladies were present in the chat, but just chose not to share video.
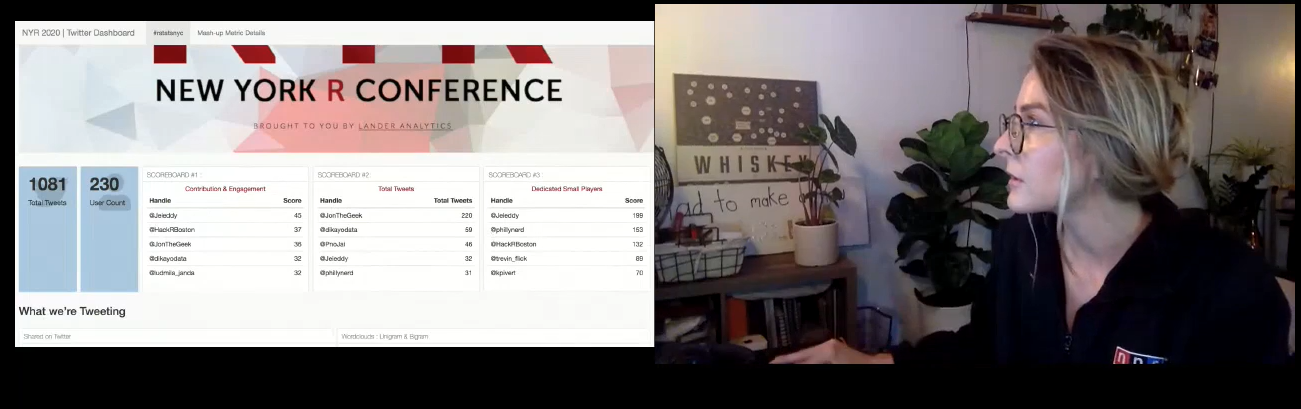
Jon Harmon, Edna Mwenda, and Jessica Streeter win Raspberri Pis, Bluetooth Headphones, and Tenkeyless Keyboards for Most Active Tweeting During the Conference
This year’s Twitter Contest, in Malorie’s words, was a “ruthless but noble war.” You can see the NYR 2020 Dashboard here. A custom started that DCR 2018 by our Twitter scorekeeper Malorie Hughes (@data_all_day) has returned every year by popular demand, and now she’s stuck with it forever! Congratulations to our winners!
50+ Conference Attendees Participated in Pre-Conference Workshops Before
For the first time ever, workshops took place over the course of several days to promote work-life balance, and to give attendees the chance to take more than one course. We ran the following seven workshops:
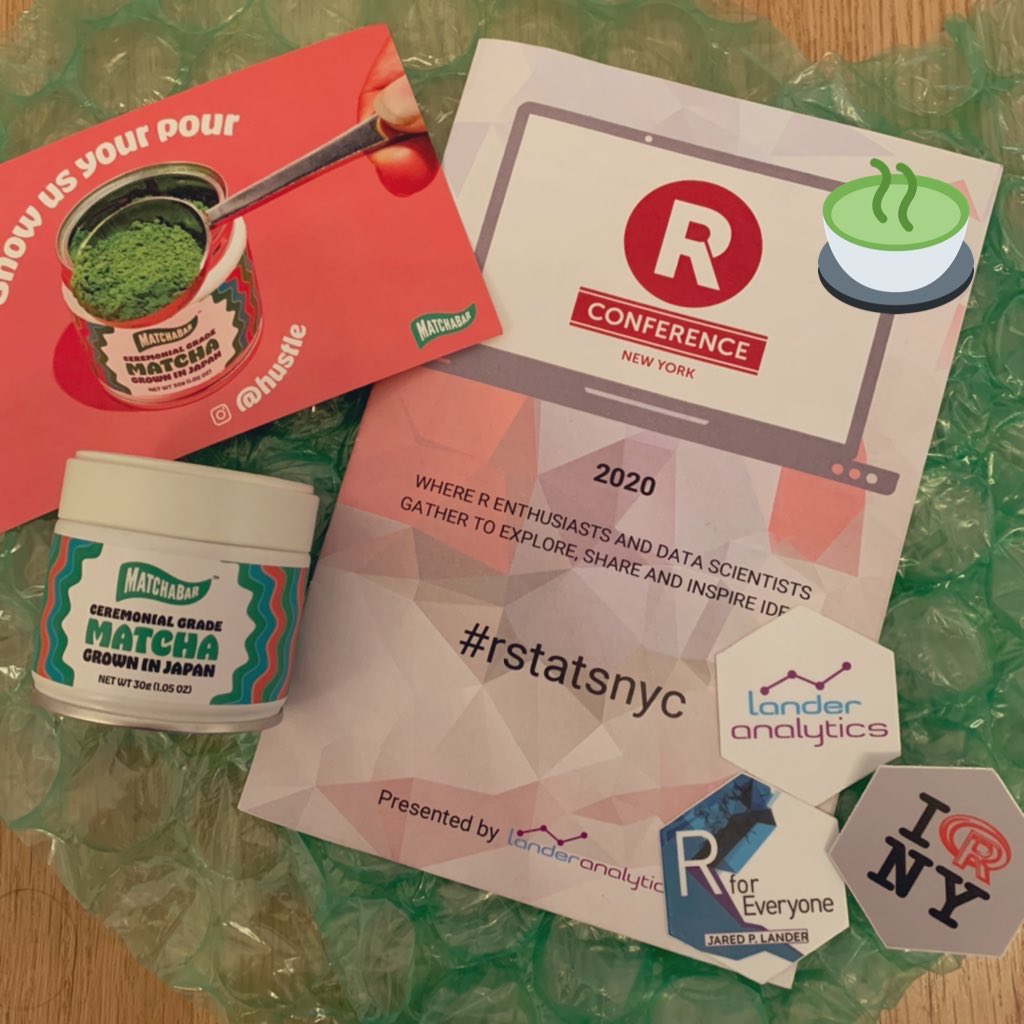
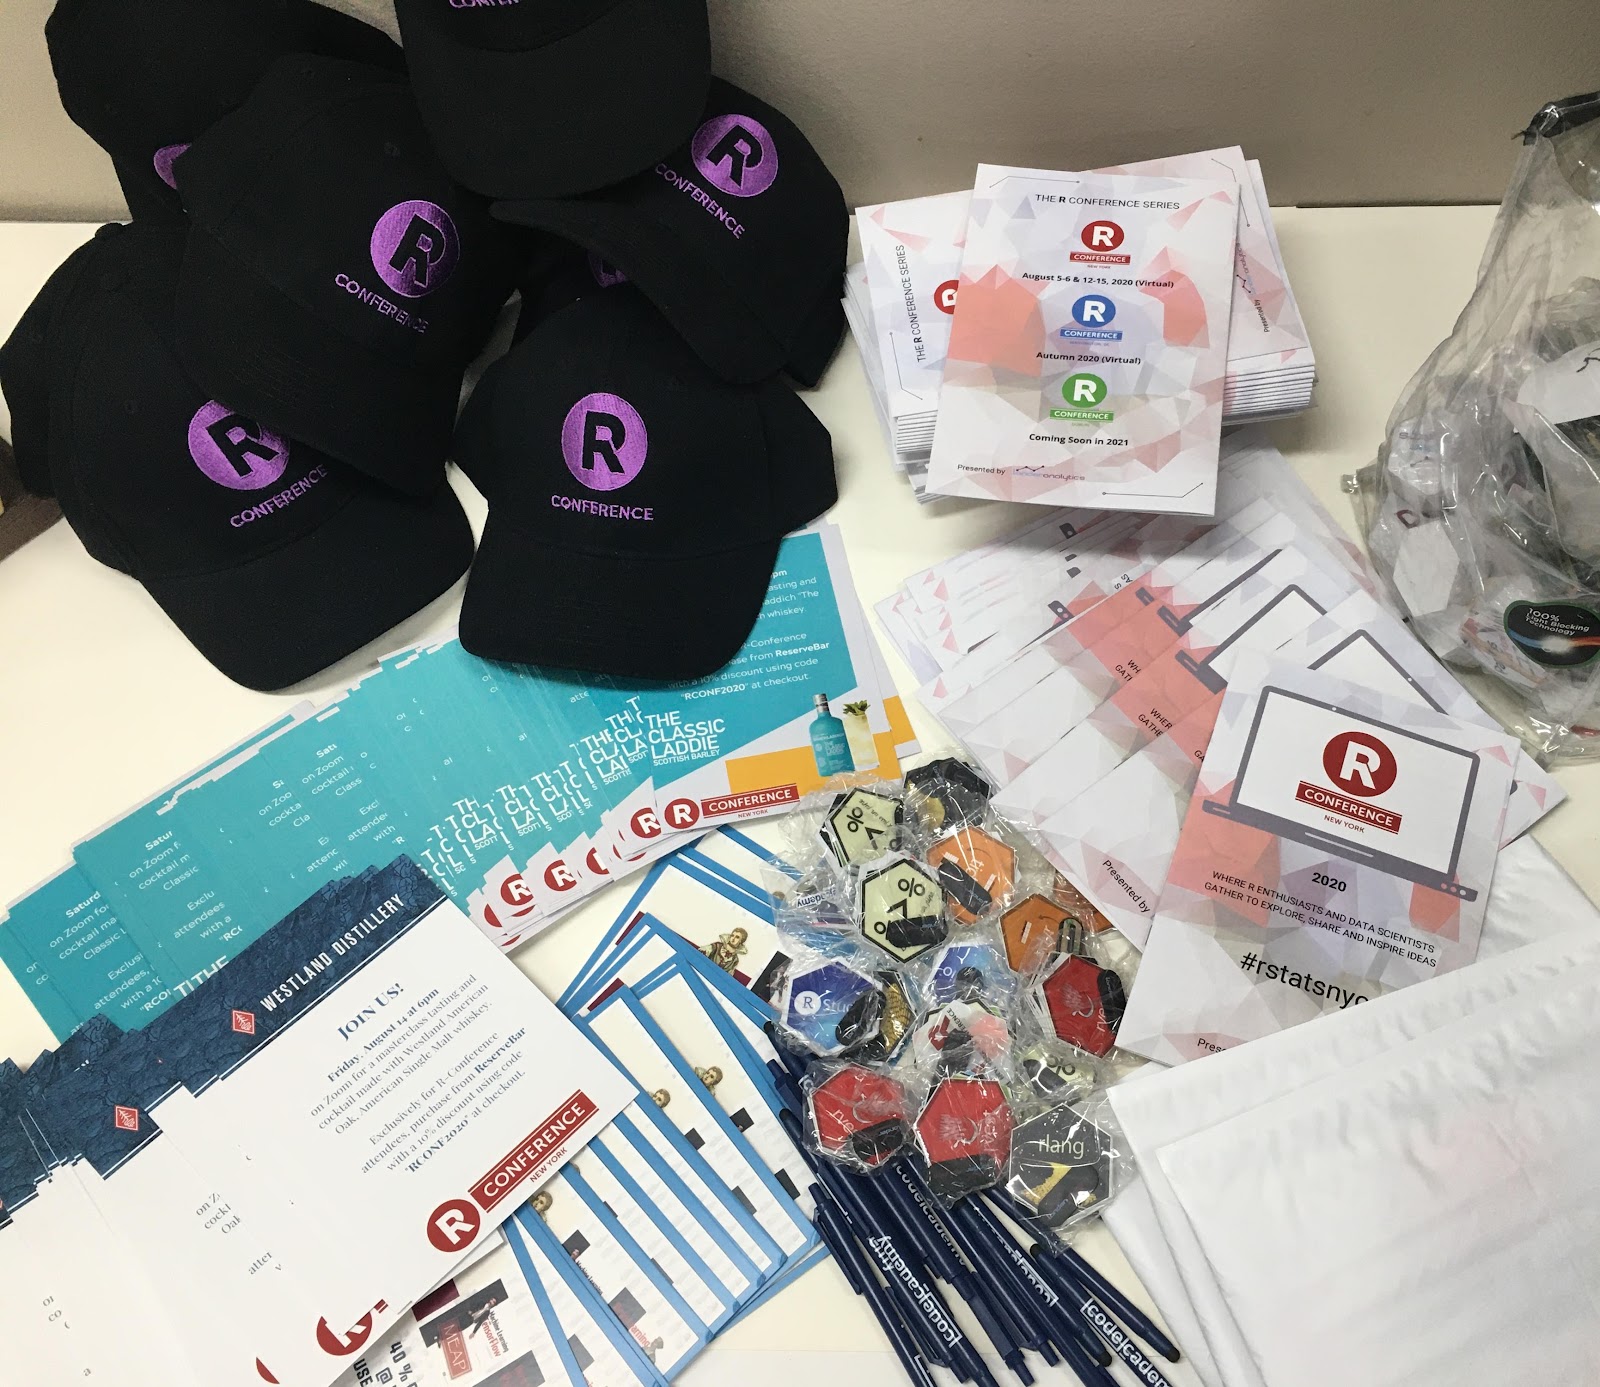
We recreated as much of the in-person experience as possible with attendee networking sessions, the speaker walk-on songs and fun facts, abundant prizes and giveaways, the Twitter contest, an art auction, and happy hours. In addition to all of this, we mailed conference programs, hex stickers, and other swag to each attendee (in the U.S.), along with discount codes from our Vibe Sponsors, MatchaBar, Westland Distillery and Bruichladdich Distillery.
Thank you, Lander Analytics Team!
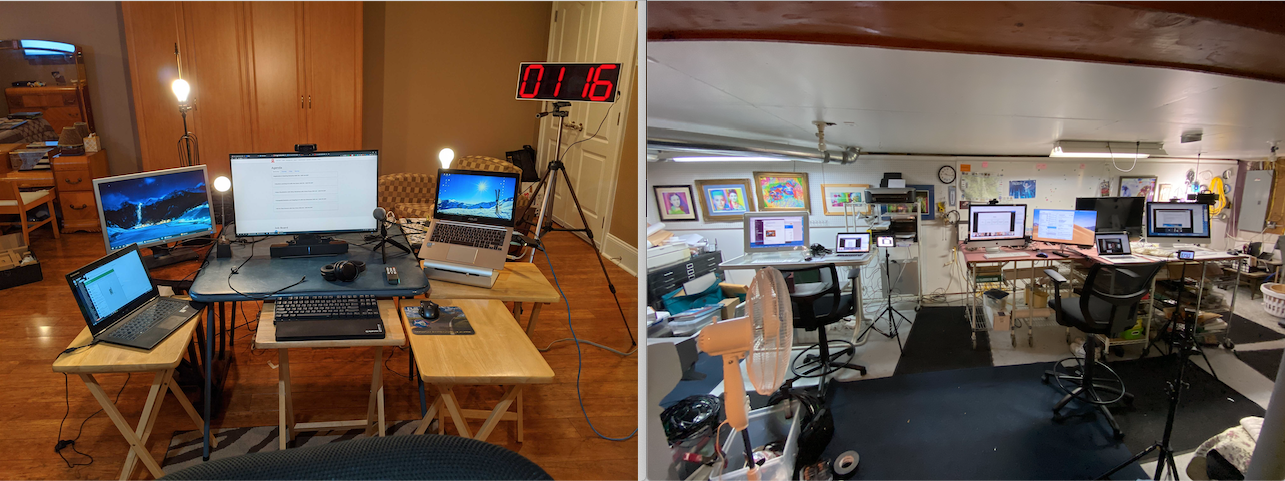
Even though it was virtual, there was a lot of work that went into the conference, and I want to thank my amazing team at Lander Analytics along with our producer, Bill Prickett, for making it all come together.
Looking Forward to D.C. and Dublin If you attended, we hope you had an incredible experience. If you did not, we hope to see you at the virtual DC R Conference in the fall, and at the first Dublin R Conference and the NYR next year!
Excited to announce that i am waiting in a LINE for the WOMEN’s restroom at a tech conference! Thanks @RLadiesNYC, @RLadiesGlobal, and @nyhackr for the opportunity, wouldn’t be here without your support
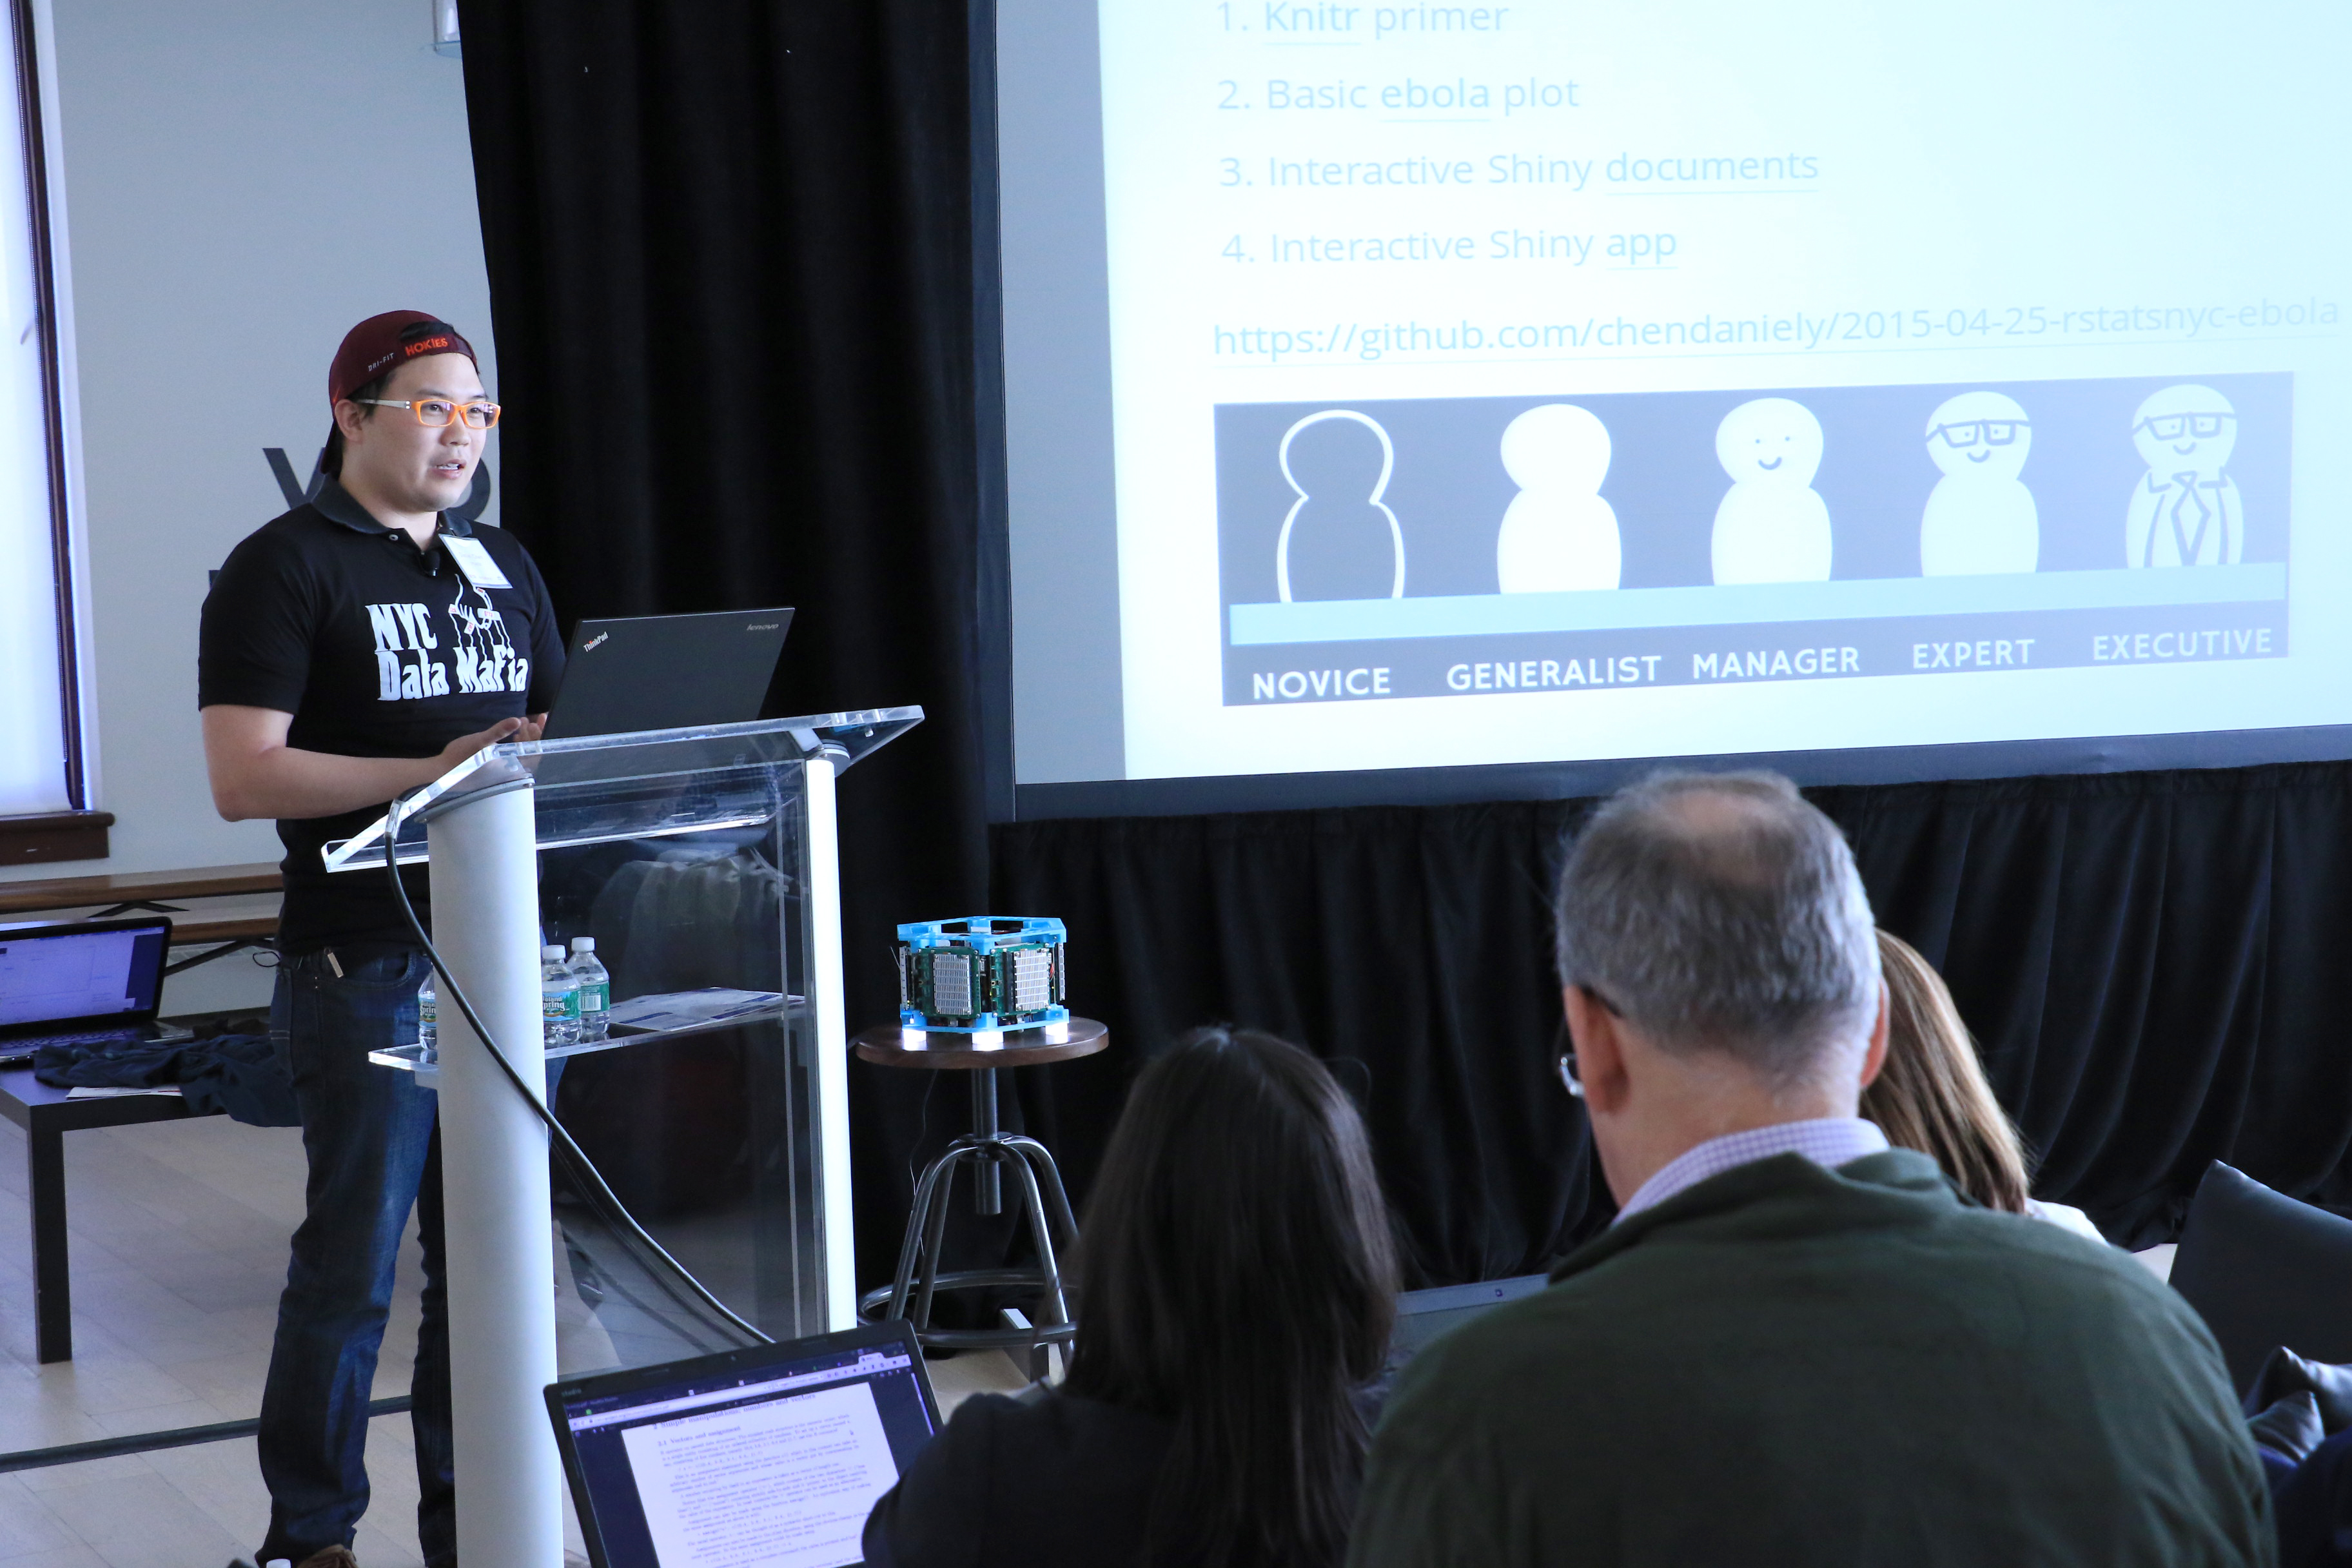
Particularly gratifying for me was seeing so many of my students speak. Eurry Kim, Dan Chen and Alex Boghosian all gave excellent talks.
Some highlights that stuck out to me are:
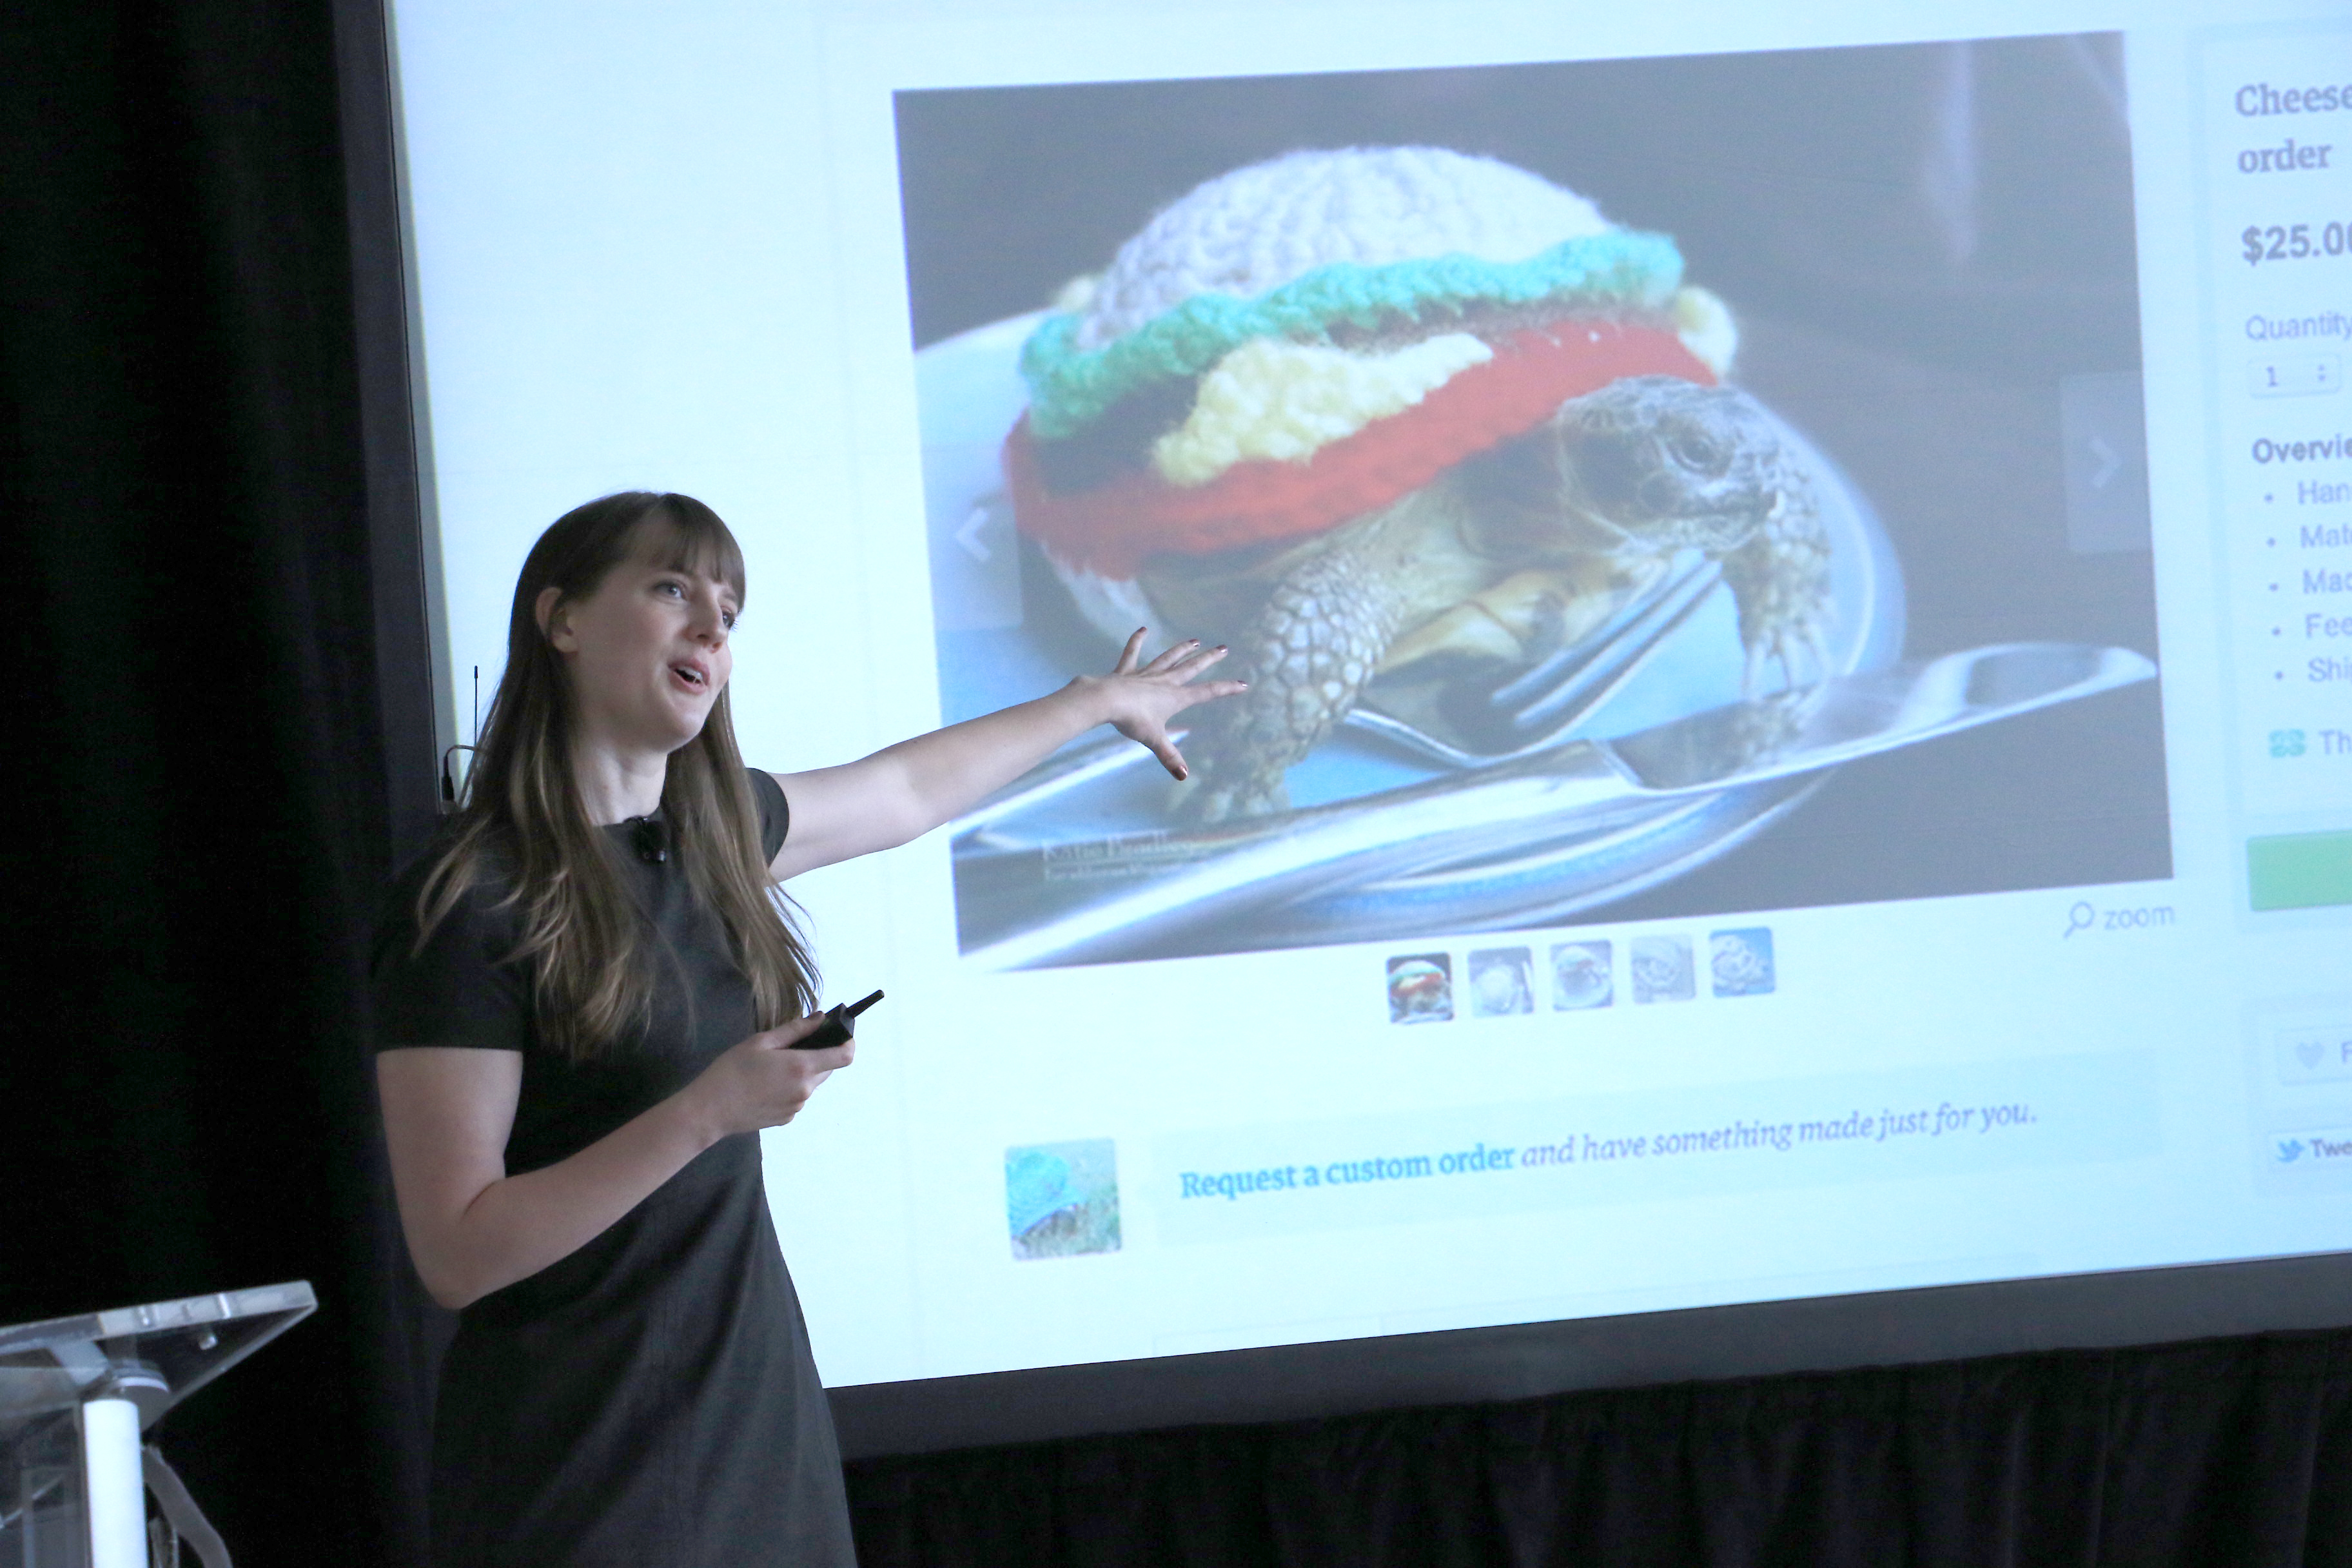
Emily Robinson Shows There is More to the Tidyverse than Hadley
Emily Robinson, otherwise known as ERob, gave an excellent talk showing how the Tidyverse is so much more than just Hadley and that there are many people inspired by him to contribute in the Tidy way.
Sean Taylor Forecasted the Future with Prophet
Sean Taylor, former New Yorker and unrepentant Eagles fan, demonstrate his powerful R and Python, package Prophet, for forecasting time series data. Facebook open sourced his work so we could all benefit.
Hadley Wickham showed us how to get into the internals of R and figure out how to examine objects from a memory perspective.
Jennifer Hill Demonstrated Awesome Machine Learning Techniques for Causal Inference
Following her sold-out meetup appearance in March, Jennifer continued to push the boundaries of causal inference.
I Made the Authors of Caret and scitkit-learn Show That R and Python Can Get Along
While both Andreas and Max gave great individual talks, I made them pose for this peace-making photo.
David Robinson Got the Upper Hand in a Sibling Twitter Duel
Given only about 30 minutes notice, David put together an entire slideshow on how to livetweet and how to compete with your sibling.
In the End Emily Robinson Beat Her Brother For Best Tweeting
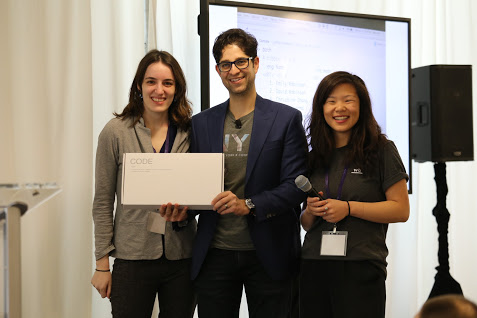
Despite David’s headstart Emily was the best tweeter (as calculated by Max Kuhn and Mara Averick) so she won the WASD Code mechanical keyboard with MX Cherry Clear switches.
Silent Auction of Data Paintings
Thomas Levine made paintings of famous datasets that we auctioned off with the proceeds supporting the R Foundation and the Free Software Foundation. The Robinson family very graciously chipped in and bought the painting of the Pizza Poll data for me! I’m still floored by this and in love with the painting.
You might be asking yourself, “How was the 2016 New York R Conference?”
Well, if we had to sum it up in one picture, it would look a lot like this (thank you to Drew Conway for the slide & delivering the battle cry for data science in NYC):
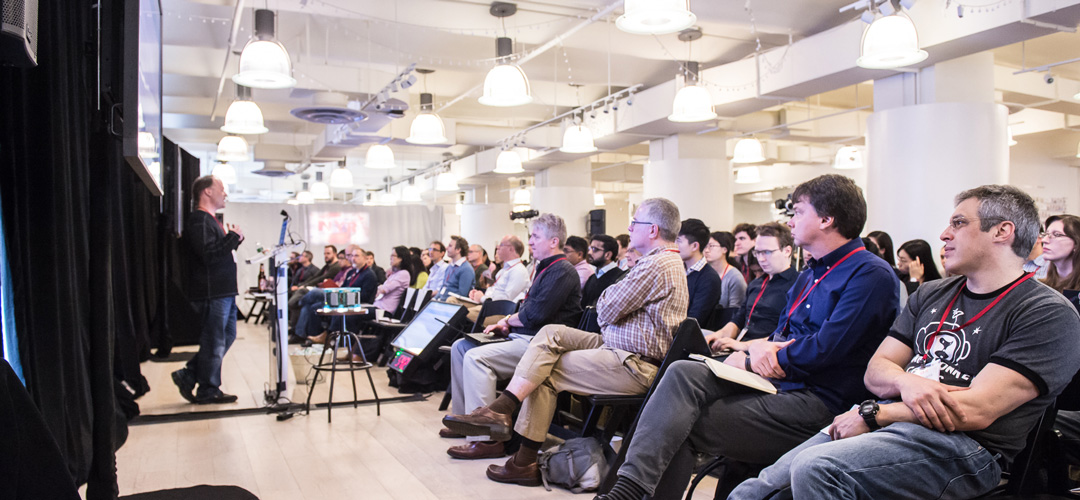
Our 2nd annual, sold-out New York R Conference was back this year on April 8th & 9th at Work-Bench. Co-hosted with our friends at Lander Analytics, this year’s conference was bigger and better than ever, with over 250 attendees, and speakers from Airbnb, AT&T, Columbia University, eBay, Etsy, RStudio, Socure, and Tamr. In case you missed the conference or want to relive the excitement, all of the talks and slides are now live on the R Conference website.
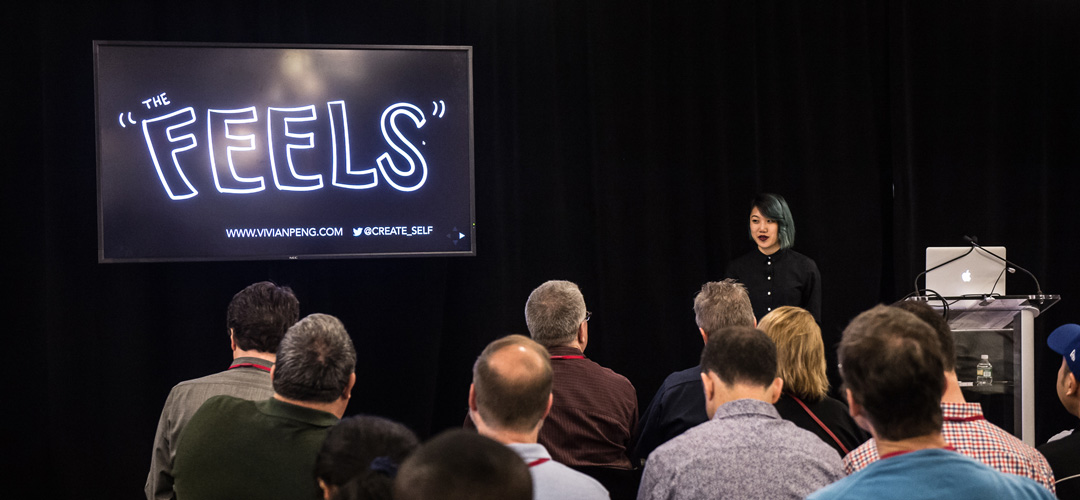
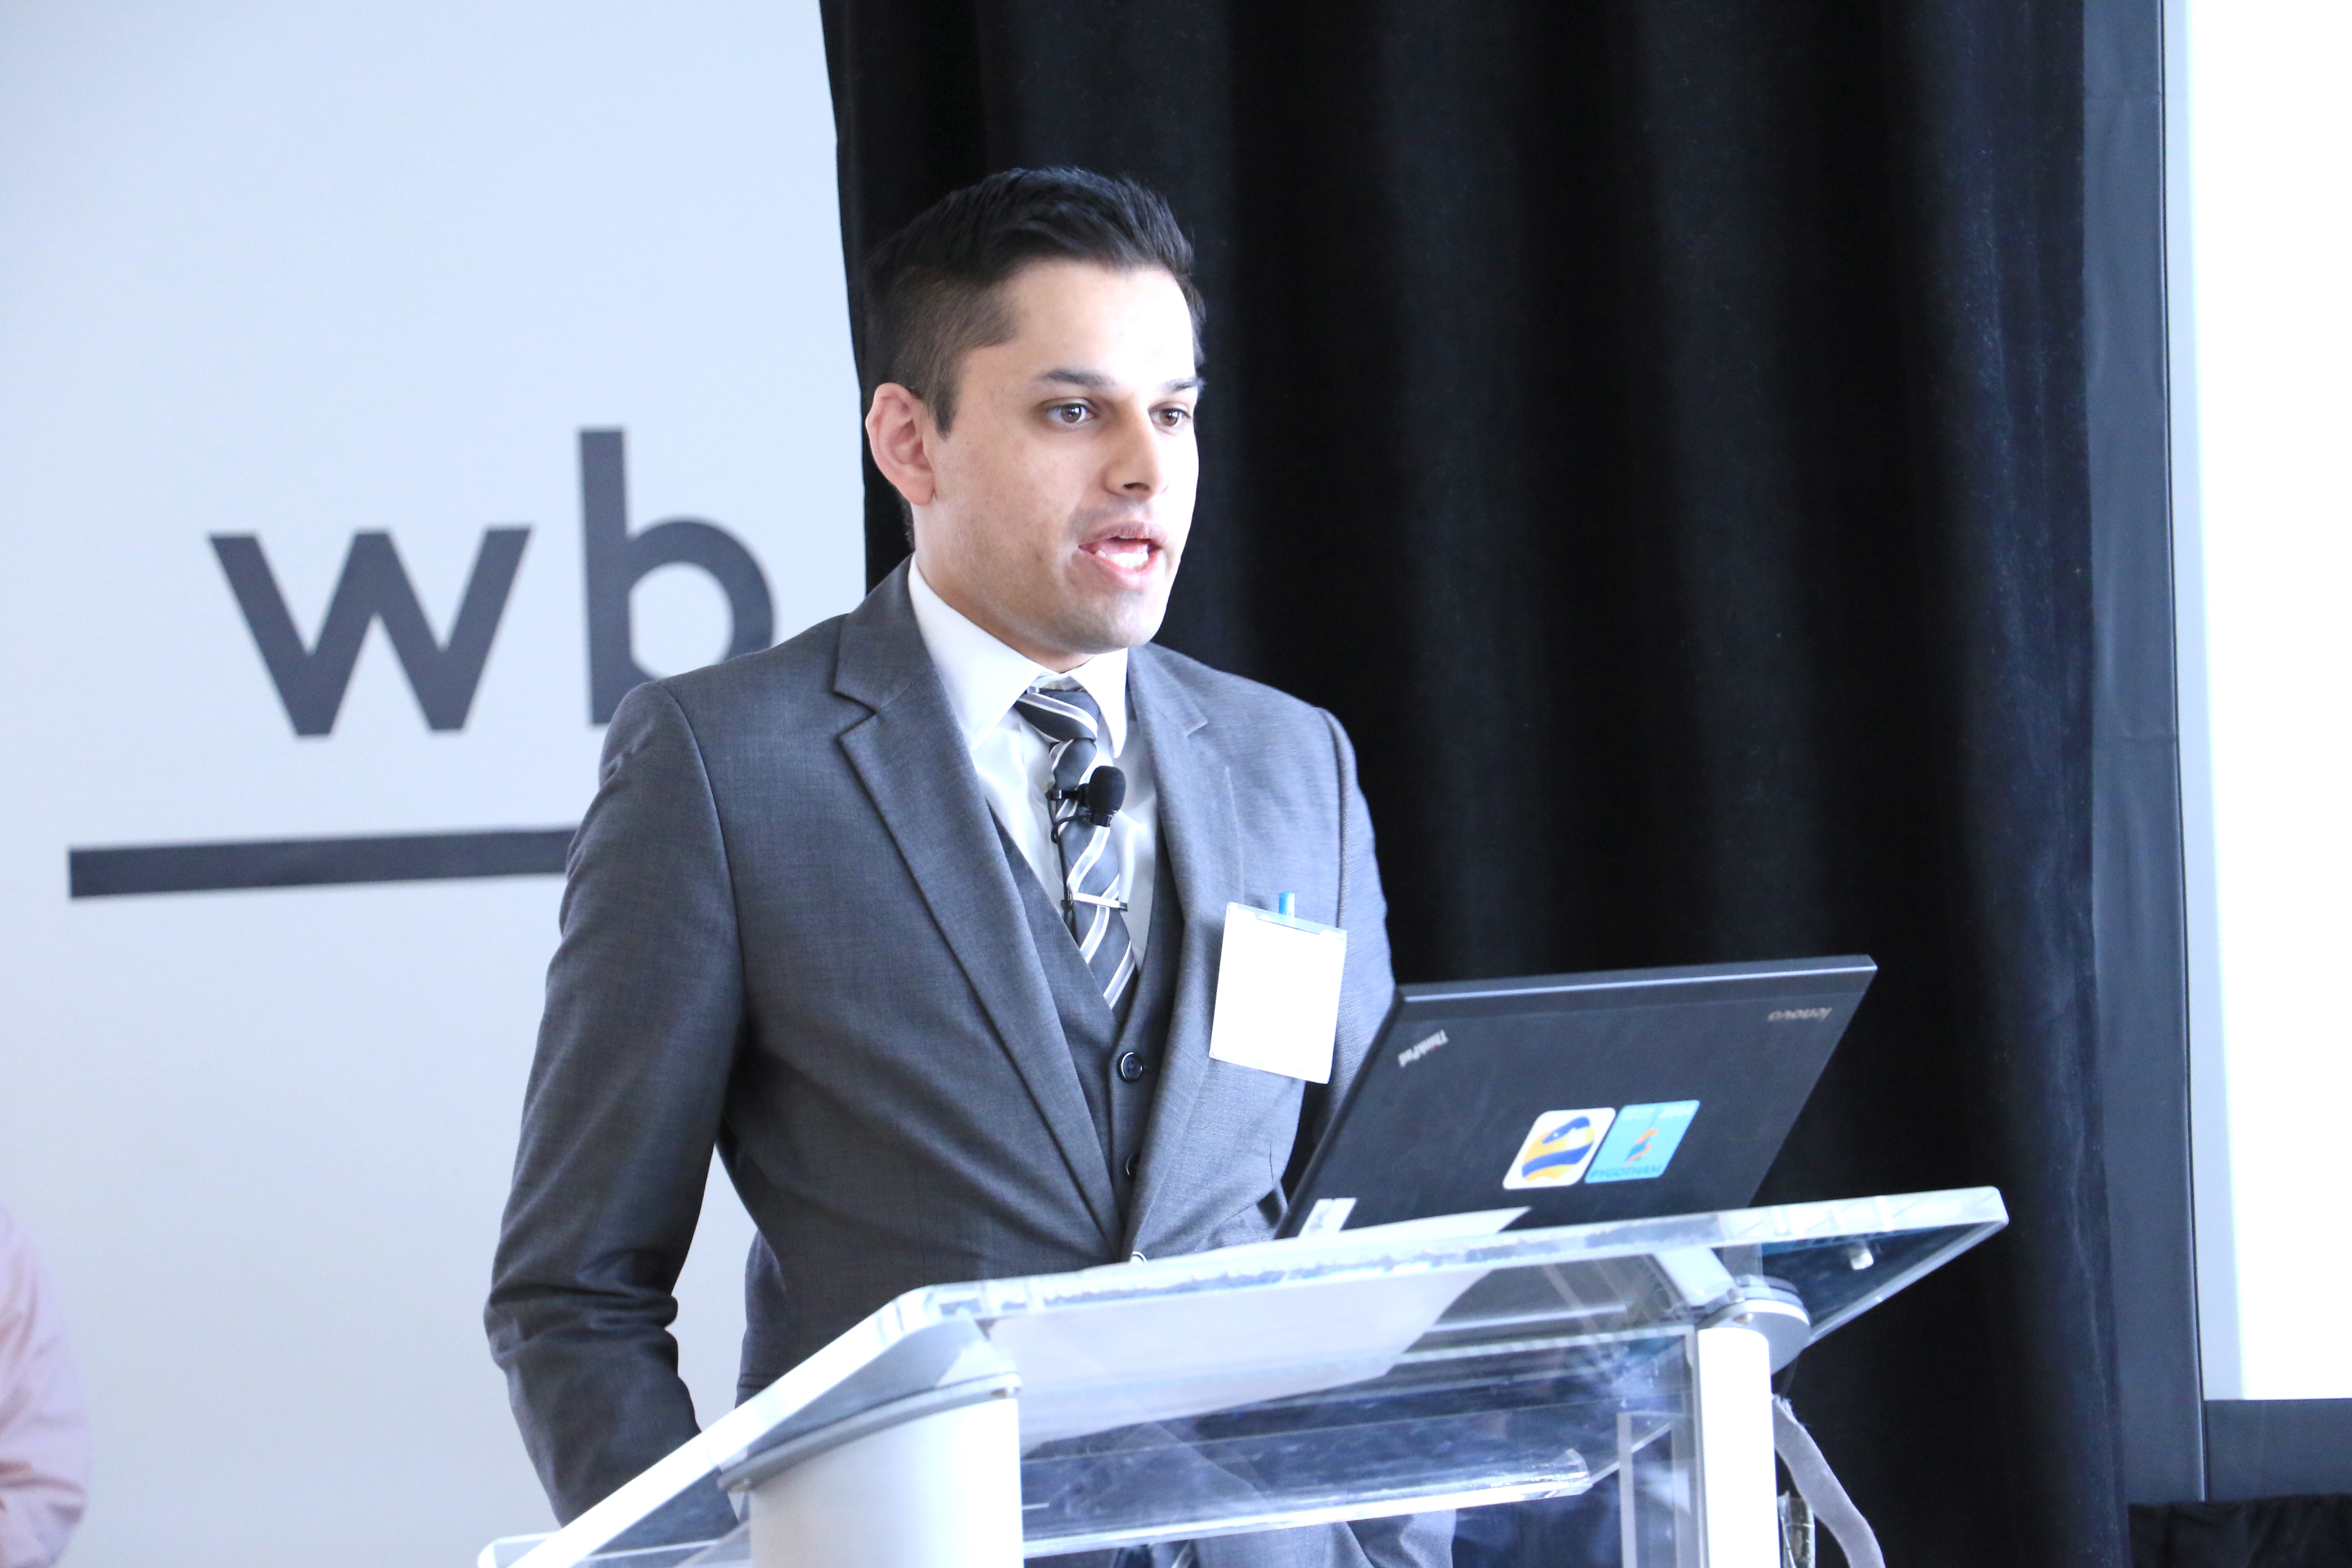
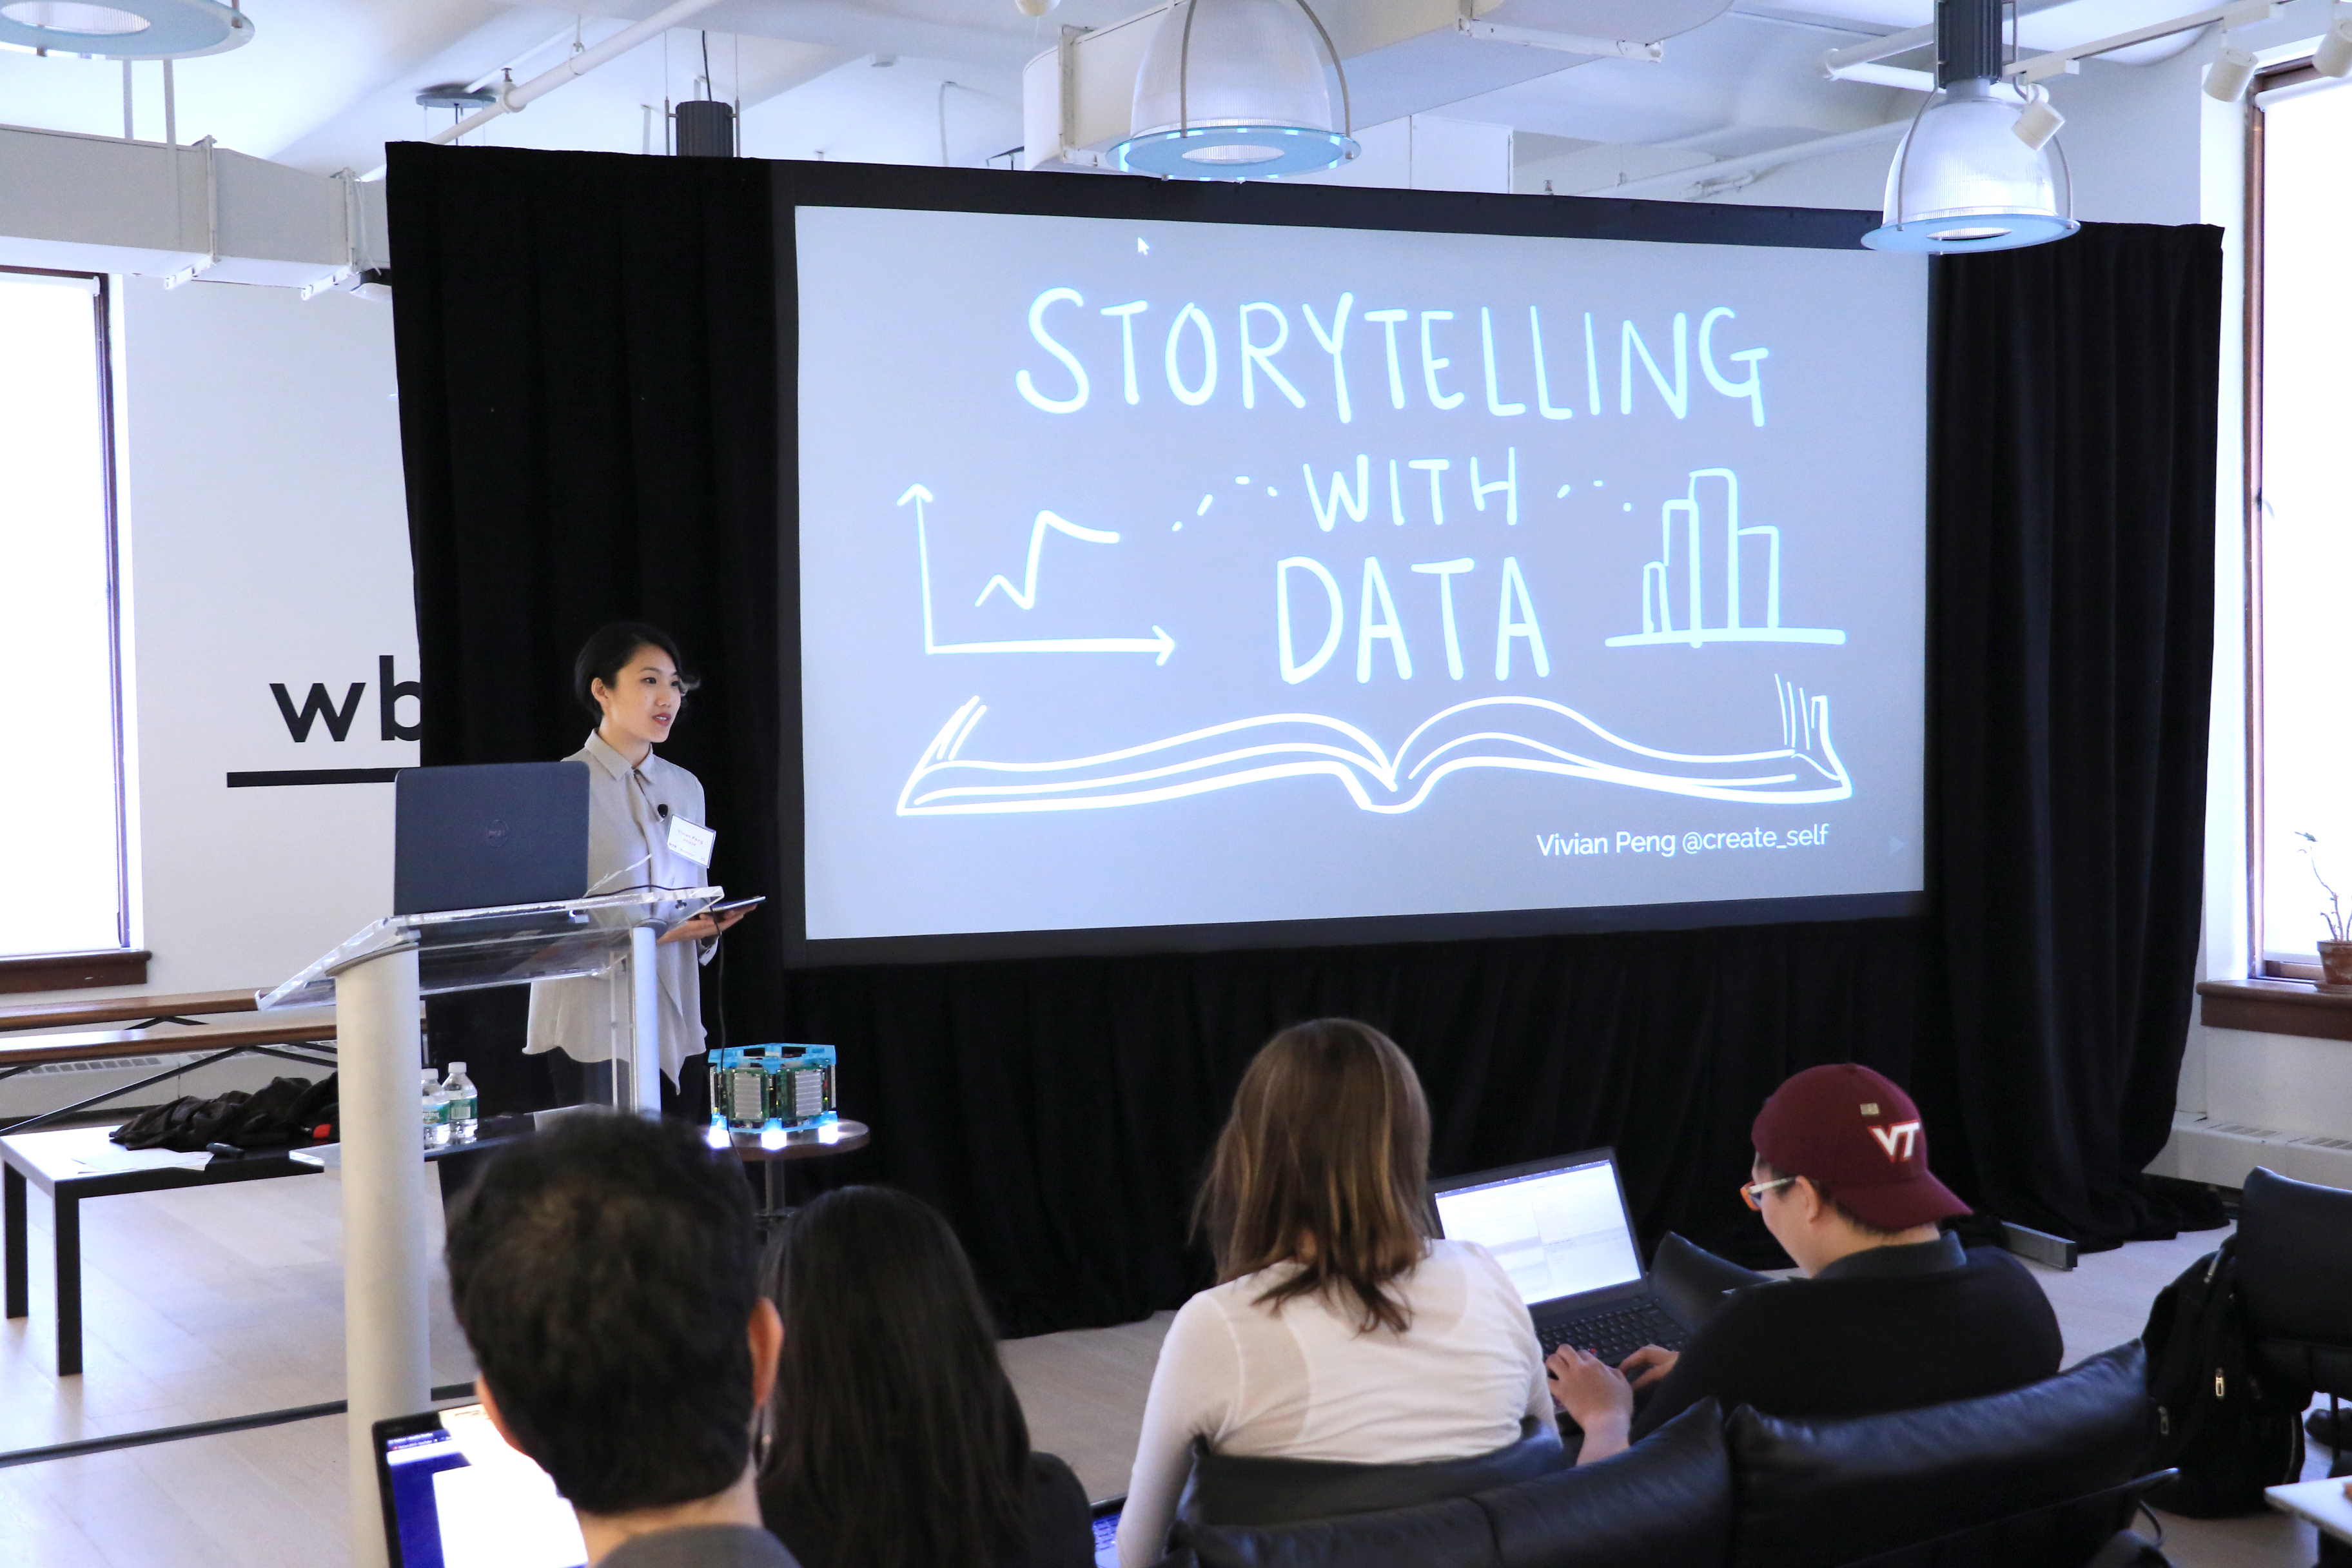
With 30 talks, each 20 minutes long and two forty-minute keynotes, the topics of the presentations were just as diverse as the speakers. Vivian Peng gave an emotional talk on data visualization using non-visual senses and “The Feels.” Bryan Lewis measured the shadows of audience members to demonstrate the pros and cons of projection methods, and Daniel Lee talked about life, love, Stan, and March Madness. But, even with 32 presentations from a diverse selection of speakers, two dominant themes emerged: 1) Community and 2) Writing better code.
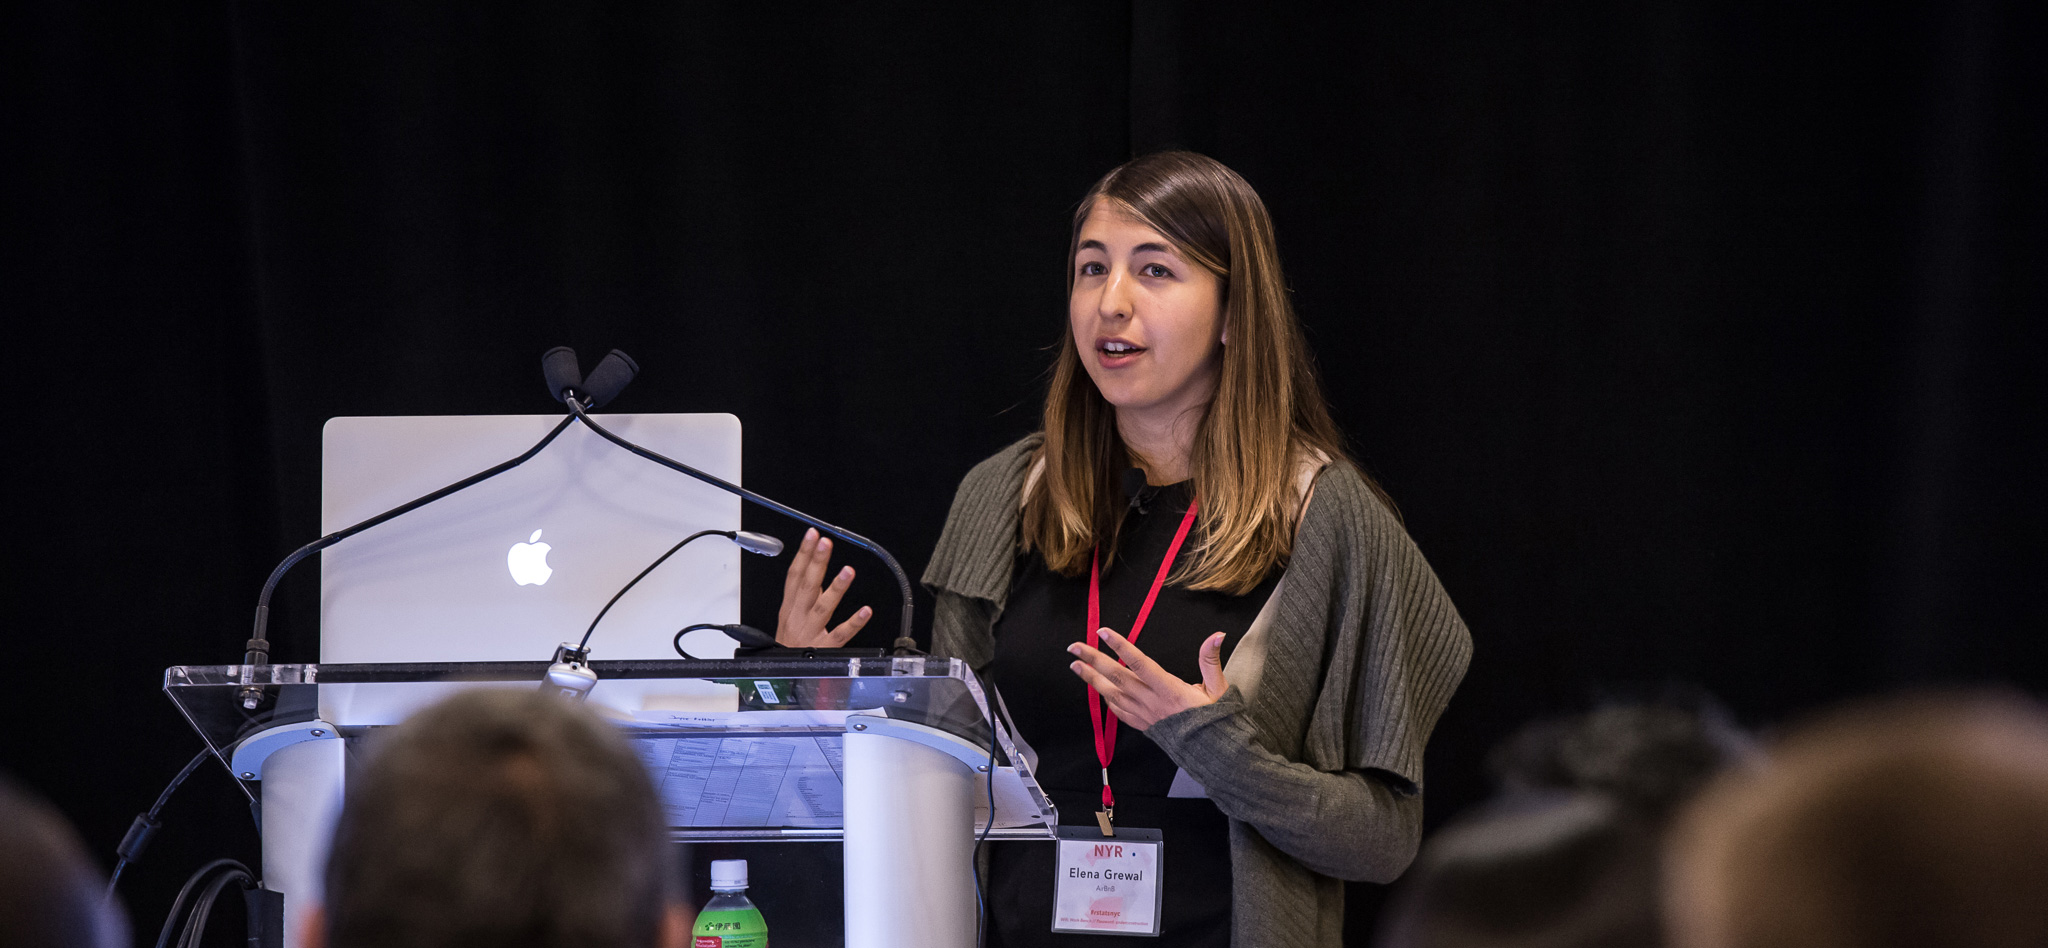
Given the amazing caliber of speakers and attendees, community was on everyone’s mind from the start. Drew Conway emoted the past, present, and future of data science in NYC, and spoke to the dangers of tearing down the tent we built. Joe Rickert from Microsoft discussed the R Consortium and how to become involved. Wes McKinney talked about community efforts in improving interoperability between data science languages with the new Feather data frame file format under the Apache Arrow project. Elena Grewal discussed how Airbnb’s data science team made changes to the hiring process to increase the number of female hires, and Andrew Gelman even talked about how your political opinions are shaped by those around you in his talk about Social Penumbras.
Writing better code also proved to be a dominant theme throughout the two day conference. Dan Chen of Lander Analytics talked about implementing tests in R. Similarly, Neal Richardson and Mike Malecki of Crunch.io talked about how they learned to stop munging and love tests, and Ben Lerner discussed how to optimize Python code using profilers and Cython. The perfect intersection of themes came from Bas van Schaik of Semmle who discussed how to use data science to write better code by treating code as data. While everyone had some amazing insights, these were our top five highlights:
JJ Allaire Releases a New Preview of RStudio
JJ Allaire, the second speaker of the conference, got the crowd fired up by announcing new features of RStudio and new packages. Particularly exciting was bookdown for authoring large documents, R Notebooks for interactive Markdown files and shared sessions so multiple people can code together from separate computers.
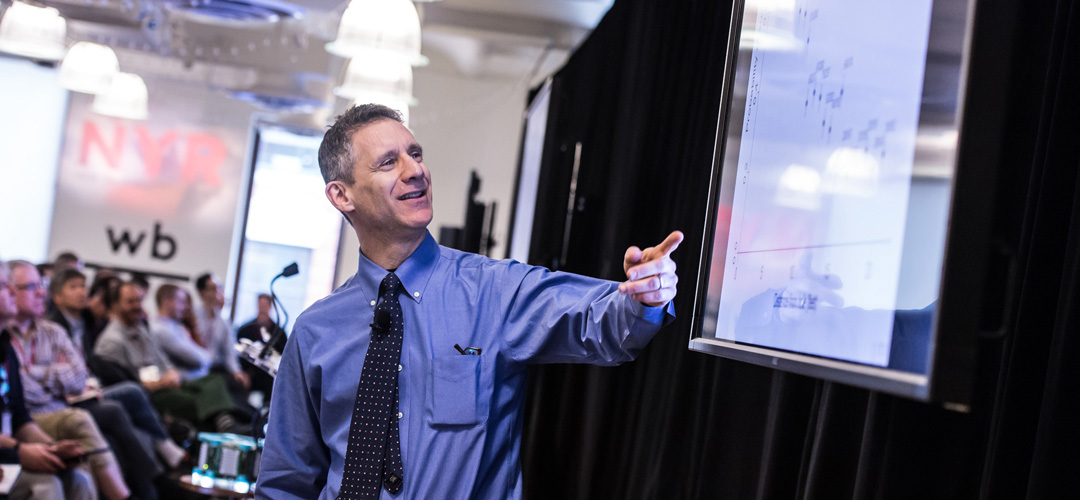
Andrew Gelman Discusses the Political Impact of the Social Penumbra
As always, Dr. Andrew Gelman wowed the crowd with his breakdown of how political opinions are shaped by those around us. He utilized his trademark visualizations and wit to convey the findings of complex models.
Vivian Peng Helps Kick off the Second Day with a Punch to the Gut
On the morning of the second day of the conference, Vivian Peng gave a heartfelt talk on using data visualization and non-visual senses to drive emotional reaction and shape public opinion on everything from the Syrian civil war to drug resistance statistics.
Ivor Cribben Studies Brain Activity with Time Varying Networks
University of Alberta Professor Ivor Cribben demonstrated his techniques for analyzing fMRI data. His use of network graphs, time series and extremograms brought an academic rigor to the conference.
Elena Grewal Talks About Scaling Data Science at Airbnb
After a jam-packed 2 full days, Elena Grewal helped wind down the conference with a thoughtful introspection on how Airbnb has grown their data science team from 5 to 70 people, with a focus on increasing diversity and eliminating bias in the hiring process.
On April 24th and 25th Lander Analytics and Work-Bench coorganized the (sold-out) inaugural New York R Conference. It was an amazing weekend of nerding out over R and data, with a little Python and Julia mixed in for good measure. People from all across the R community gathered to see rockstars discuss their latest and greatest efforts.