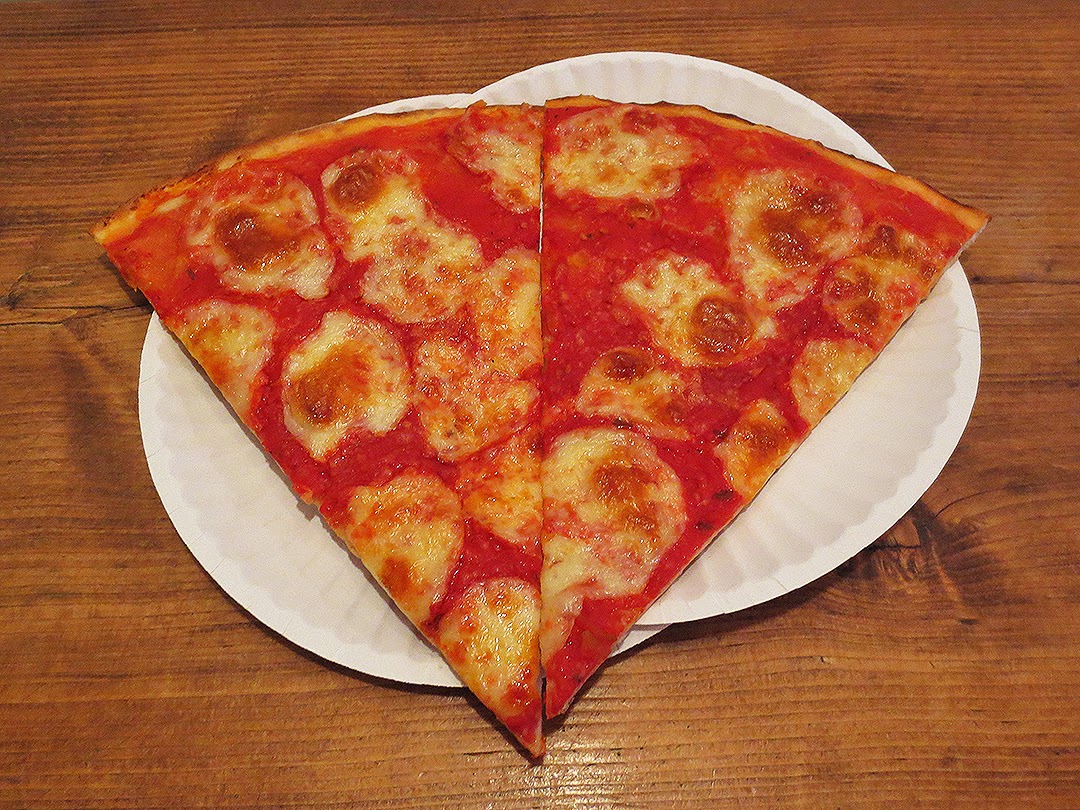
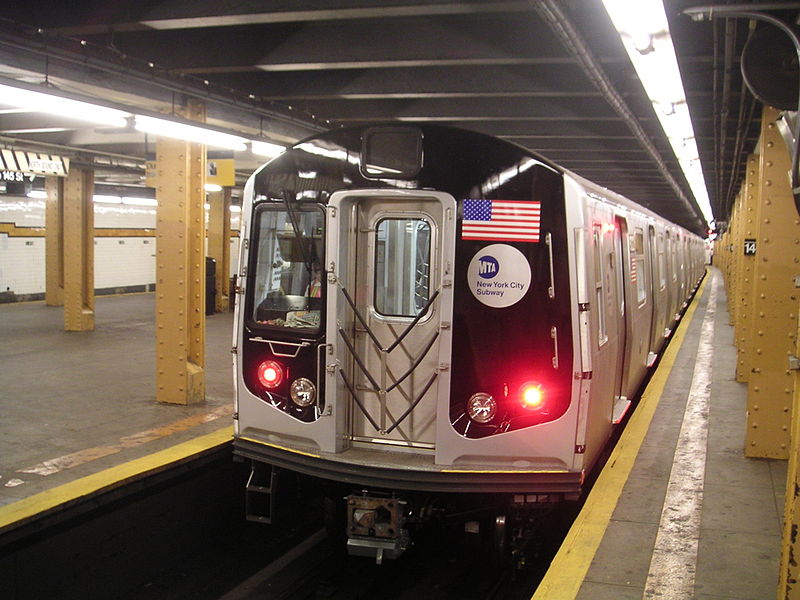
The other night I attended a talk about the history of Brooklyn pizza at the Brooklyn Historical Society by Scott Wiener of Scott’s Pizza Tours. Toward the end, a woman stated she had a theory that pizza slice prices stay in rough lockstep with New York City subway fares. Of course, this is a well known relationship that even has its own Wikipedia entry, so Scott referred her to a New York Times article from 1995 that mentioned the phenomenon.
However, he wondered if the preponderance of dollar slice shops has dropped the price of a slice below that of the subway and playfully joked that he wished there was a statistician in the audience.
Naturally, that night I set off to calculate the current price of a slice in New York City using listings from MenuPages. I used R’s XML package to pull the menus for over 1,800 places tagged as “Pizza” in Manhattan, Brooklyn and Queens (there was no data for Staten Island or The Bronx) and find the price of a cheese slice.
After cleaning up the data and doing my best to find prices for just cheese/plain/regular slices I found that the mean price was $2.33 with a standard deviation of $0.52 and a median price of $2.45. The base subway fare is $2.50 but is actually $2.38 after the 5% bonus for putting at least $5 on a MetroCard.
So, even with the proliferation of dollar slice joints, the average slice of pizza ($2.33) lines up pretty nicely with the cost of a subway ride ($2.38).
Taking it a step further, I broke down the price of a slice in Manhattan, Queens and Brooklyn. The vertical lines represented the price of a subway ride with and without the bonus. We see that the price of a slice in Manhattan is perfectly right there with the subway fare.

MenuPages even broke down Queens Neighborhoods so we can have a more specific plot. 
The code for downloading the menus and the calculations is after the break.
First we have to get the URLs for each place tagged as “Pizza” which we get from http://www.menupages.com/restaurants/all-areas/all-neighborhoods/pizza and all of its subsequent pages. My XML isn’t the greatest so this might be unnecessarily complicated.
require(XML)
require(plyr)
require(stringr)

numPages <- 19

get.restaurants <- function(address)
{
    # parse the html so it's ready to use
    doc <- htmlParse(address)

    # build data.frame of the URL for the restaurant page and the name of the place
    # do not do recursive so it does not grab the span with the row number
    placeNameLink <- ldply(xpathApply(doc, "//table/tr/td[@class='name-address']/a[@class='link']", fun = function(x){ c(Name=xmlValue(x, recursive = F), Link=xmlAttrs(x)[2]) }))

    # Figure out how many stars the place is rated based on the URL for the star image
    placeRatingImg <- ldply(xpathApply(doc, "//table/tr/td[@class='rating']/img", fun=function(x) c(Stars=xmlAttrs(x)[1])))
    placeRating <- str_extract(placeRatingImg$Stars.src, pattern="\\d(_\\d)?")
    placeRating <- as.numeric(str_replace(placeRating, "_", "."))

    # Figure out the number of dolar signs
    placePrice <- xpathApply(doc, "//table/tr/td[@class='price']", fun=function(x) nchar(xmlValue(x)))
    placePrice <- sapply(placePrice, identity)

    # Find the number of reviews
    placeReviews <- xpathApply(doc, "//table/tr/td[@class='reviews']", xmlValue)
    placeReviews <- sapply(placeReviews, as.numeric)

    # combine them together
    places <- cbind(placeNameLink, Rating=placeRating, Price=placePrice, Reviews=placeReviews)

    return(places)
}

urls <- sprintf("http://www.menupages.com/restaurants/all-areas/all-neighborhoods/pizza/%s/", seq_len(numPages))
places <- adply(urls, 1, get.restaurants)
Then we need to download each of those pages individually. To speed things up we do this in parallel using the foreach and doParallel packages.
require(foreach)
require(doParallel)

dataDir <- "data"
subFolder <- "menuDir"

# get rid of listing with special character
places <- places[which(!str_detect(places$Link.href, "Ã|Â")), ]
rownames(places) <- NULL

# get root url for file name
places$FileName <- file.path(dataDir, subFolder, sprintf("%s.%s", str_replace_all(places$Link.href, "(/restaurants/)|(/$)", ""), "rdata"))

# spell out the full URL
places$Link.href <- sprintf("http://www.menupages.com%smenu", places$Link.href)

# setup the cluster
cl <- makeCluster(2)
registerDoParallel(cl)

foreach(i=539:nrow(places)) %dopar%
{
    thePage <- readLines(places$Link.href[i])
    save(thePage, file=places$FileName[i])
}

# stop the cluster
stopCluster(cl)
Now we only keep the places that at least mention the word slice in the menu.
require(dplyr)
# clean up the data a bit
places <- places[which(!str_detect(places$FileName, "\\t")), ]
places <- places %>% select(-X1)

# setup the cluster
cl <- makeCluster(2)
registerDoParallel(cl)

# see if slice is mentioned at least once
containsSlice <- parSapply(cl, places$FileName, function(x){ load(x); sum(stringr::str_detect(thePage, stringr::ignore.case("slice"))) })

# stop the cluster
stopCluster(cl)

places$Slice <- containsSlice

places <- places %>% filter(Slice >= 1)
To parse the menus we need a couple of helper functions.
extract.price <- function(x)
{
    as.numeric(str_replace_all(x, "[^0-9.]", ""))
}

get.items <- function(place, item="slice")
{
    # load place html
    load(place)
    # render it to grab info
    pageRender <- htmlParse(thePage)
    # get address info
    address <- xpathApply(pageRender, "//li[@class='address adr']/span[@class='addr street-address']", fun=xmlValue)[[1]]
    city <- xpathApply(pageRender, "//li[@class='address adr']/span/span[@class='locality']", fun=xmlValue)[[1]]
    state <- xpathApply(pageRender, "//li[@class='address adr']/span/span[@class='region hide-microformat']", fun=xmlValue)[[1]]
    zip <- xpathApply(pageRender, "//li[@class='address adr']/span/span[@class='postal-code']", fun=xmlValue)[[1]]

    # sometimes the slices are mentioned in the header block, not in the table itself
    headers <- xpathSApply(pageRender, "//*[@id='restaurant-menu']/h3", xmlValue)

    # get items listed in tables
    items <- xpathSApply(pageRender, "//table[starts-with(@class, 'prices-')]")
    items <- lapply(items, readHTMLTable, stringsAsFactors=FALSE)

    # if the number of headers don't match up with the number of tables, just return nothing
    if(length(headers) != length(items))
        return(NULL)

    # combine headers with tables
    names(items) <- headers
    items <- ldply(items)
    names(items) <- c("Category", "Item", "Open1", "Open2", "Price")

    # only keep rows that mention slice
    items <- items %>% filter(str_detect(Item, ignore.case(item)) | str_detect(Category, ignore.case(item)))

    # if no rows do return nothing
    if(nrow(items) == 0)
        return(NULL)

    # get pricing information
    items$Open1 <- extract.price(items$Open1)
    items$Open2 <- extract.price(items$Open2)
    items$Price <- extract.price(items$Price)

    # get ride of special characters
    items$Item <- str_replace_all(items$Item, "Â", "")

    # combine address info with menu items
    cbind(Name=place, Address=address, Boro=city, Zip=zip, items, stringsAsFactors=FALSE)
}
We apply those functions to each of the menus. In this case sequential processing was faster than parallel.
allItems <- adply(places$FileName, 1, function(x){ print(x); get.items(x) })With all of this information we are almost ready to run some numbers. But first we need to get rid of any items that are not cheese slices so we build up a lexicon of things that don’t look right such as references to mushrooms, meat, vegetables, pepperoni, sandwich, etc. . .. We also eliminate anything priced over $6 as this usually indicates a different type of item all.together.
allItems$Name <- str_replace_all(allItems$Name, "(data/menuDir/)|(\\.rdata)", "")
allItems$Name <- str_replace_all(allItems$Name, "-", " ")

allItems$Name <- str_replace_all(allItems$Name, "(data/menuDir/)|(\\.rdata)", "")
allItems$Name <- str_replace_all(allItems$Name, "-", " ")
specialNames <- c("grandma", "sicilian", "white", "topping", "salad", "meat", "extra", "Vege", "pepper", "pepp", "sausage", "mushroom", "onion", "anchov", "sand", "roll", "chicken", "strombol", "pan", "beef", "artichoke", "two", "three", "pineapple", "spinach", "black", "olive", "special", "Linguine", "veal", "pasta", "wheat", "fresh", "korea", "tripple", "calzone", "breakfast", "wrap", "soda", "can", "fruit", "square", "brocc", "marg", "nea", "prosc", "vodka", "hazel", "buffalo", "pork", "beet", "almond", "nut", "grand", "grand", "egg", "hawaii", "Bruschetta", "arugula", "apple", "tart", "steak", "chicago", "froze", "app", "deep", "bake", "ziti", "tomato", "napoli", "gourment", "fried", "double", "bbq", "feta", "hero", "broil", "ham", "fry", "knot", "bread", "supreme", "ricotta", "cookie", "shashim", "bistro", "Lasagna", "avoca", "bianca", "gourmet", "comb", "bacon", "cake", "pollo", "pastram", "\\d", "matzo", "taco", "Sfincioni", "stuff", "banana", "potato", "works", "garlic", "macaroni", "Magarita", "Designer", "nonna", "item", "Neopolitan", "Parmigiana", "granola", "pie", "Focaccia", "lime", "mango", "carrot", "blanca", "kirby", "Primavera", "delia", "Focaccia", "Buff", "chick", "Napoleon", "day", "V\\.I\\.P\\.", "Primavera", "fresca", "VIP", "ravioli", "pinwheel", "Jalapeno", "gyro", "shrimp", "old", "Jalapeno", "Marinara", "ronni", "Gramma", "tirami", "jumbo", "upside", "down", "seafood", "sea", "Calamari", "Sweet", "spice", "spicy", "Kishke", "falafel", "french", "Sfingione", "Green", "lox", "greek", "Barbacoa", "peper", "pepper", "Spigoli", "Napoletana", "baby", "Bianoco", "farm", "Casalinga", "Verdu", "madrid", "Sirignese", "penne", "pesto", "qua", "Tiramisu", "garden", "Parmigiano", "veg", "Brooklyn Pizza Slice", "New Yorker Pizza Slice", "gluten", "Zucchini", "salmon", "Sorrento", "jun", "house", "Contadina", "Caprese", "Arrabiata", "Fiorentina", "Fajita", "bagel", "stop", "salami", "lamb", "V.I.P", "Pedazo", "Foccaccia", "Roni", "Carpaccio", "filet", "grama", "kid", "Bologna", "Turkey", "swiss", "provo", "Salami", "Sopressata", "Sopressata", "Alpine", "Jarlsberg", "Muenster", "Cheddar", "Delicious", "Four", "4", "Portobello", "Foccacia", "cheeseless", "every", "Cucumbers", "soup", "Choco", "bite", "Foccacia", "jalep", "Strawberries", "cracker", "gramm", "Foccacia", "pepsi", "Mona", "Gouda", "Brie", "havarti", "Mortadella", "nona", "Crispino", "jalap", "thick", "Sicilain", "whole")
pattern <- sprintf("(%s)", paste(specialNames, collapse=")|("))
slices <- allItems %>% select(-X1) %>% filter(!str_detect(allItems$Item, ignore.case(pattern))) %>% filter(Price <= 6 | is.na(Price))
dim(slices)
slices$Price[which(is.na(slices$Price))] <- as.numeric(str_extract(slices$Category[which(is.na(slices$Price))], "\\d(\\.\\d{2})?"))
slices$Price[is.na(slices$Price)] <- as.numeric(str_extract(slices$`NA`[is.na(slices$Price)], "\\d(\\.\\d{2})?"))

slices$Borough <- ifelse(slices$Boro == "New York", "Manhattan", ifelse(slices$Boro == "Brooklyn", "Brooklyn", "Queens"))
Finally time to run some numbers.
mean(slices$Price, na.rm=TRUE)## [1] 2.332median(slices$Price, na.rm=TRUE)## [1] 2.45sliceBorough <- slices %>% group_by(Borough) %>% dplyr::summarize(Mean=mean(Price, na.rm=TRUE), Median=median(Price, na.rm=TRUE), SD=sd(Price, na.rm=TRUE), count=length(Price)) %>% mutate(Lower=Mean - 2*SD, Upper=Mean + 2*SD)
sliceHood <- slices %>% group_by(Boro, Borough) %>% dplyr::summarize(Mean=mean(Price, na.rm=TRUE), Median=median(Price, na.rm=TRUE), SD=sd(Price, na.rm=TRUE), count=length(Price)) %>% mutate(Lower=Mean - 2*SD, Upper=Mean + 2*SD)
sliceBorough## Source: local data frame [3 x 7]
##
## Borough Mean Median SD count Lower Upper
## 1 Brooklyn 2.301 2.25 0.4854 219 1.330 3.272
## 2 Manhattan 2.456 2.50 0.6201 240 1.216 3.696
## 3 Queens 2.210 2.25 0.3508 192 1.509 2.912sliceHood## Source: local data frame [37 x 8]
## Groups: Boro
##
## Boro Borough Mean Median SD count Lower Upper
## 1 Astoria Queens 2.281 2.250 0.28864 31 1.7034 2.858
## 2 Bayside Queens 2.375 2.350 0.09574 4 2.1835 2.566
## 3 Bellerose Queens 2.450 2.450 NaN 1 NaN NaN
## 4 Brooklyn Brooklyn 2.301 2.250 0.48541 219 1.3305 3.272
## 5 College Point Queens 2.000 2.000 0.00000 2 2.0000 2.000
## 6 Corona Queens 2.185 2.165 0.20345 6 1.7781 2.592
## 7 East Elmhurst Queens 2.300 2.300 NaN 2 NaN NaN
## 8 Elmhurst Queens 1.950 2.000 0.08660 3 1.7768 2.123
## 9 Far Rockaway Queens 2.500 2.500 0.70711 2 1.0858 3.914
## 10 Floral Park Queens 2.350 2.350 NaN 1 NaN NaN
## 11 Flushing Queens 2.435 2.400 0.42051 13 1.5936 3.276
## 12 Forest Hills Queens 2.393 2.500 0.19670 7 1.9995 2.786
## 13 Fresh Meadows Queens 2.500 2.500 0.00000 4 2.5000 2.500
## 14 Hollis Queens 2.650 2.650 NaN 1 NaN NaN
## 15 Howard Beach Queens 2.750 2.750 0.00000 2 2.7500 2.750
## 16 Jackson Heights Queens 2.131 2.000 0.26059 11 1.6097 2.652
## 17 Jamaica Queens 2.136 2.000 0.49653 12 1.1433 3.129
## 18 Kew Gardens Queens 2.250 2.250 NaN 1 NaN NaN
## 19 Little Neck Queens 2.500 2.500 NaN 2 NaN NaN
## 20 Long Island City Queens 2.212 2.250 0.33885 8 1.5348 2.890
## 21 Maspeth Queens 1.939 2.250 0.65768 10 0.6236 3.254
## 22 Middle Village Queens 2.125 2.250 0.25000 4 1.6250 2.625
## 23 New York Manhattan 2.456 2.500 0.62013 240 1.2160 3.696
## 24 Oakland Gardens Queens 2.250 2.250 0.00000 3 2.2500 2.250
## 25 Ozone Park Queens 2.036 2.000 0.33630 7 1.3631 2.708
## 26 Queens Village Queens 2.250 2.250 NaN 1 NaN NaN
## 27 Rego Park Queens 2.375 2.375 0.17678 2 2.0214 2.729
## 28 Richmond Hill Queens 2.220 2.250 0.13038 5 1.9592 2.481
## 29 Ridgewood Queens 2.106 2.250 0.32983 18 1.4459 2.765
## 30 Rosedale Queens 2.050 1.900 0.39686 3 1.2563 2.844
## 31 South Ozone Park Queens 2.750 2.750 NaN 1 NaN NaN
## 32 South Richmond Hill Queens 2.250 2.250 0.35355 2 1.5429 2.957
## 33 St Albans Queens 2.250 2.250 NaN 1 NaN NaN
## 34 Sunnyside Queens 2.200 2.250 0.20917 5 1.7817 2.618
## 35 Whitestone Queens 2.050 2.000 0.44721 5 1.1556 2.944
## 36 Woodhaven Queens 1.917 1.750 0.28868 3 1.3393 2.494
## 37 Woodside Queens 2.128 2.200 0.13489 9 1.8580 2.398And now we use ggplot to make the plots.
require(ggplot2)
require(scales)
ggplot(sliceBorough, aes(x=Mean, y=reorder(Borough, Mean))) + geom_errorbarh(aes(xmin=Lower, xmax=Upper), height=0, color="blue") + geom_point(color="blue") + geom_vline(xintercept=c(2.38, 2.50), linetype=2, color="grey") + ylab("Neighborhood") + ggtitle("Slice Price") + scale_x_continuous(labels=dollar)
ggplot(sliceHood, aes(x=Mean, y=reorder(Boro, Mean), color=Borough)) + geom_errorbarh(aes(xmin=Lower, xmax=Upper), height=0) + geom_point() + geom_vline(xintercept=c(2.38, 2.50), linetype=2, color="grey") + ylab("Neighborhood") + ggtitle("Slice Price") + scale_x_continuous(labels=dollar)

Jared Lander is the Chief Data Scientist of Lander Analytics a New York data science firm, Adjunct Professor at Columbia University, Organizer of the New York Open Statistical Programming meetup and the New York and Washington DC R Conferences and author of R for Everyone.


look, i know jack about coding but you’re awesome – nicely done 🙂
Thanks!
Hey Jared,
Very interesting and nicely done! But could you tell me why the prices rise together? is there a reason that the cost rises together? like does the head of the metro really like pizza or something?
Thanks
Rich
Thank you. This was totally not a causal analysis. For the why I’m going to direct you to Scott of Scott’s Pizza Tours. He’ll have a better chance of explaining why.
Thank you for this analysis, I grew up in NY and always wondered specifically how dollar pizza operations affected this principle. Great research and reporting!
While the dollar slice places don’t seem to affect the The Pizza Principle much, they have had a deleterious effect on the fortunes of corner slice shops.