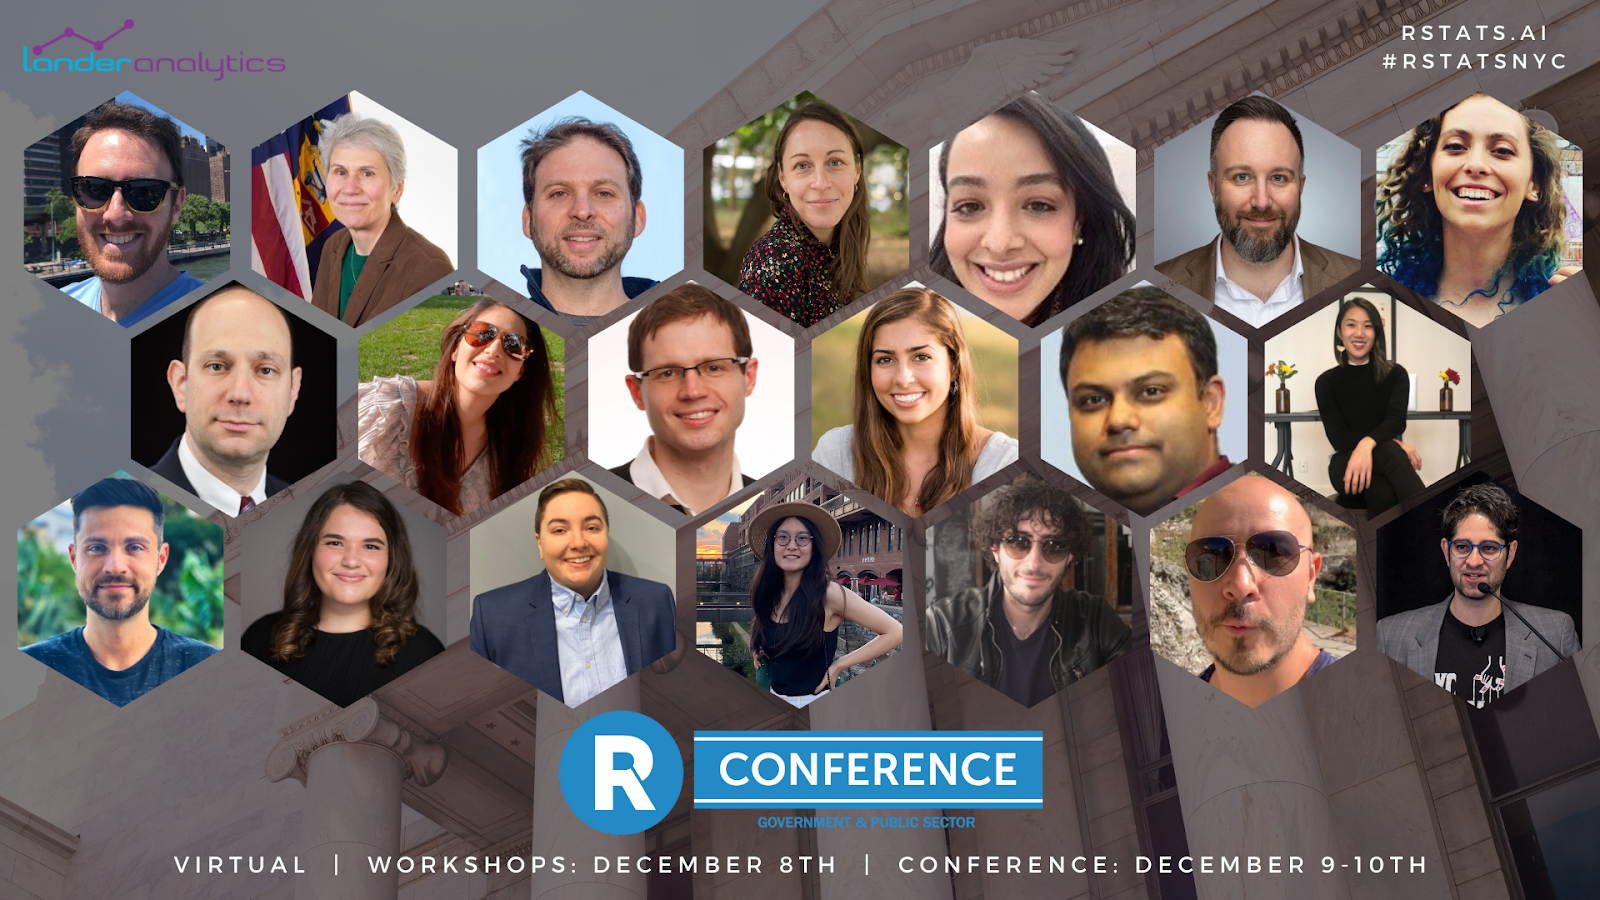
We are so excited to bring back the fourth annual Government and Public Sector R Conference to a computer screen near you! Join us on December 9th and 10th for a jam-packed two-day conference filled with an incredible lineup of speakers across the government and public sector space.
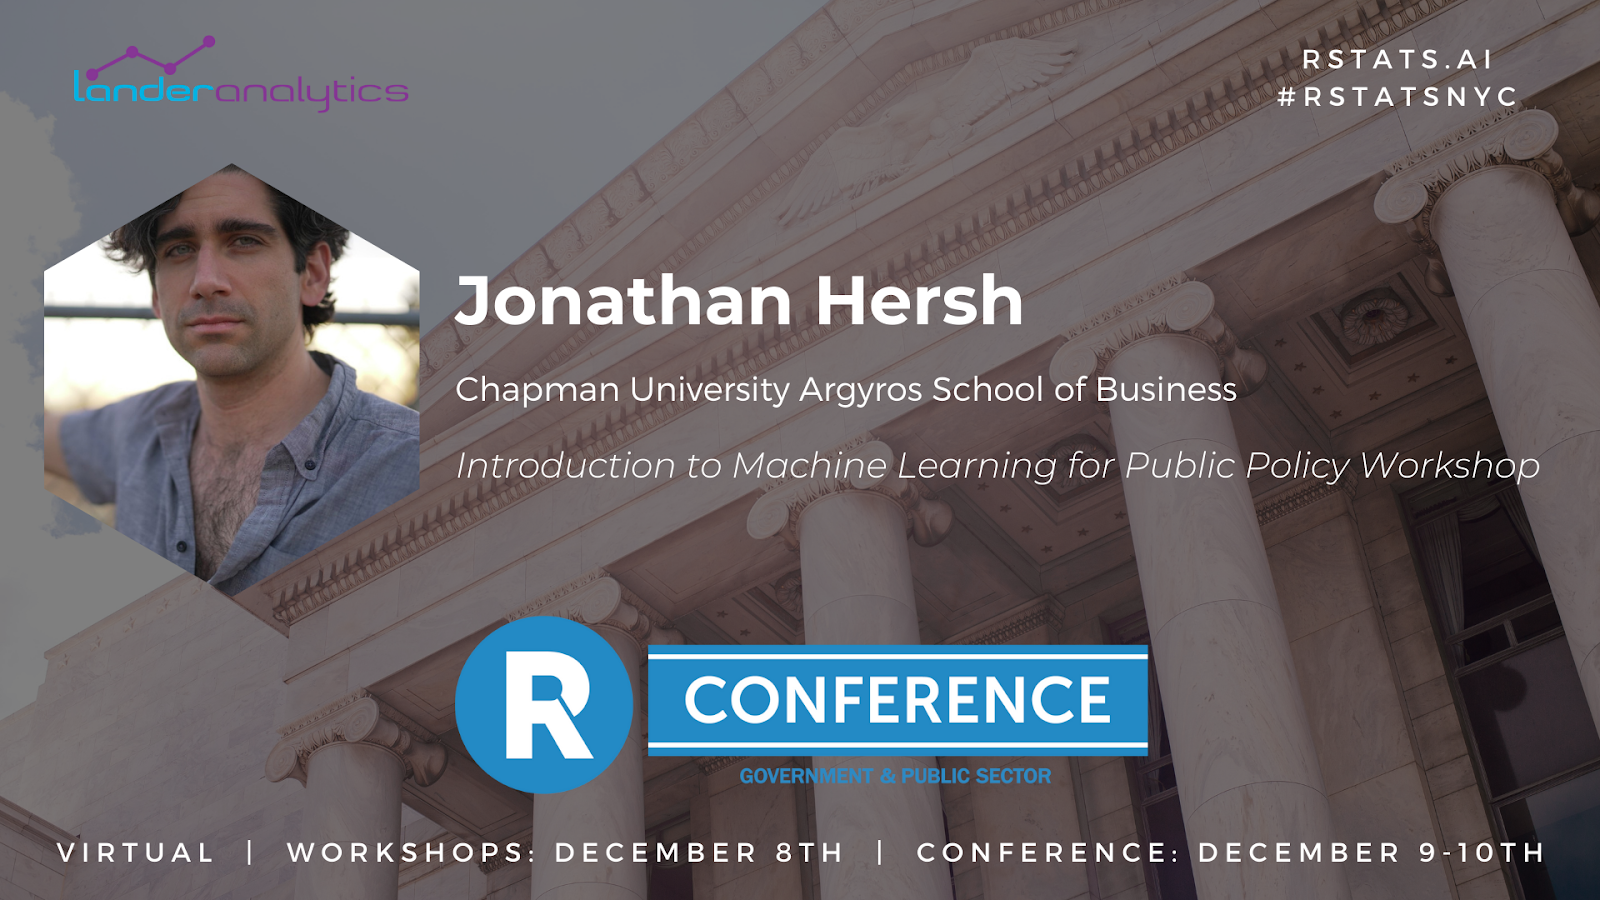
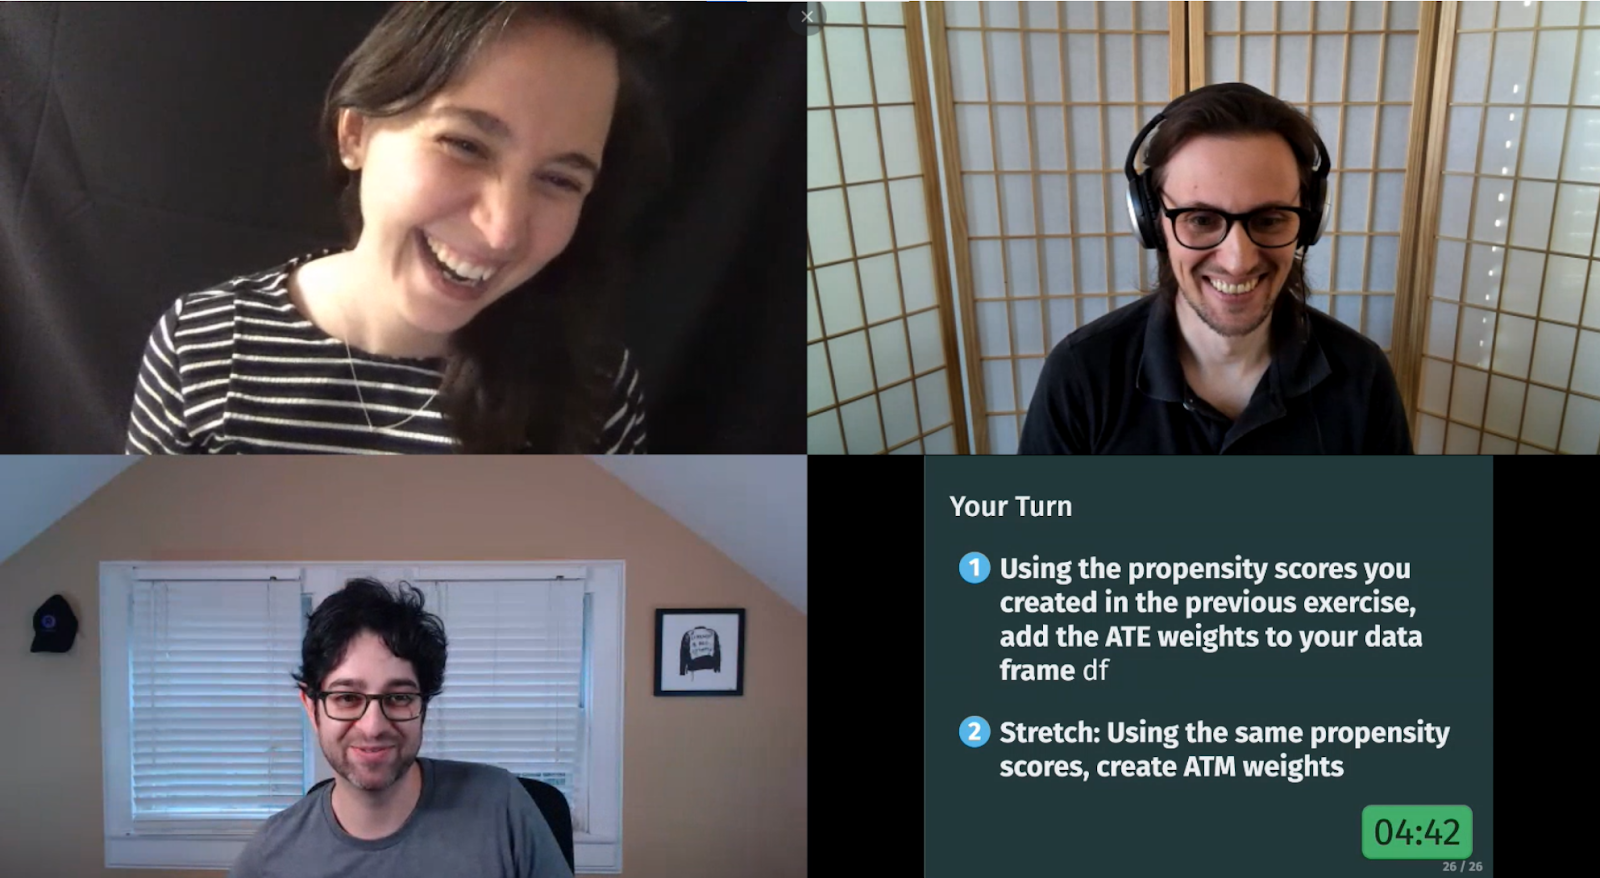
Introduction to Machine Learning for Public Policy with Jonathan Hersh
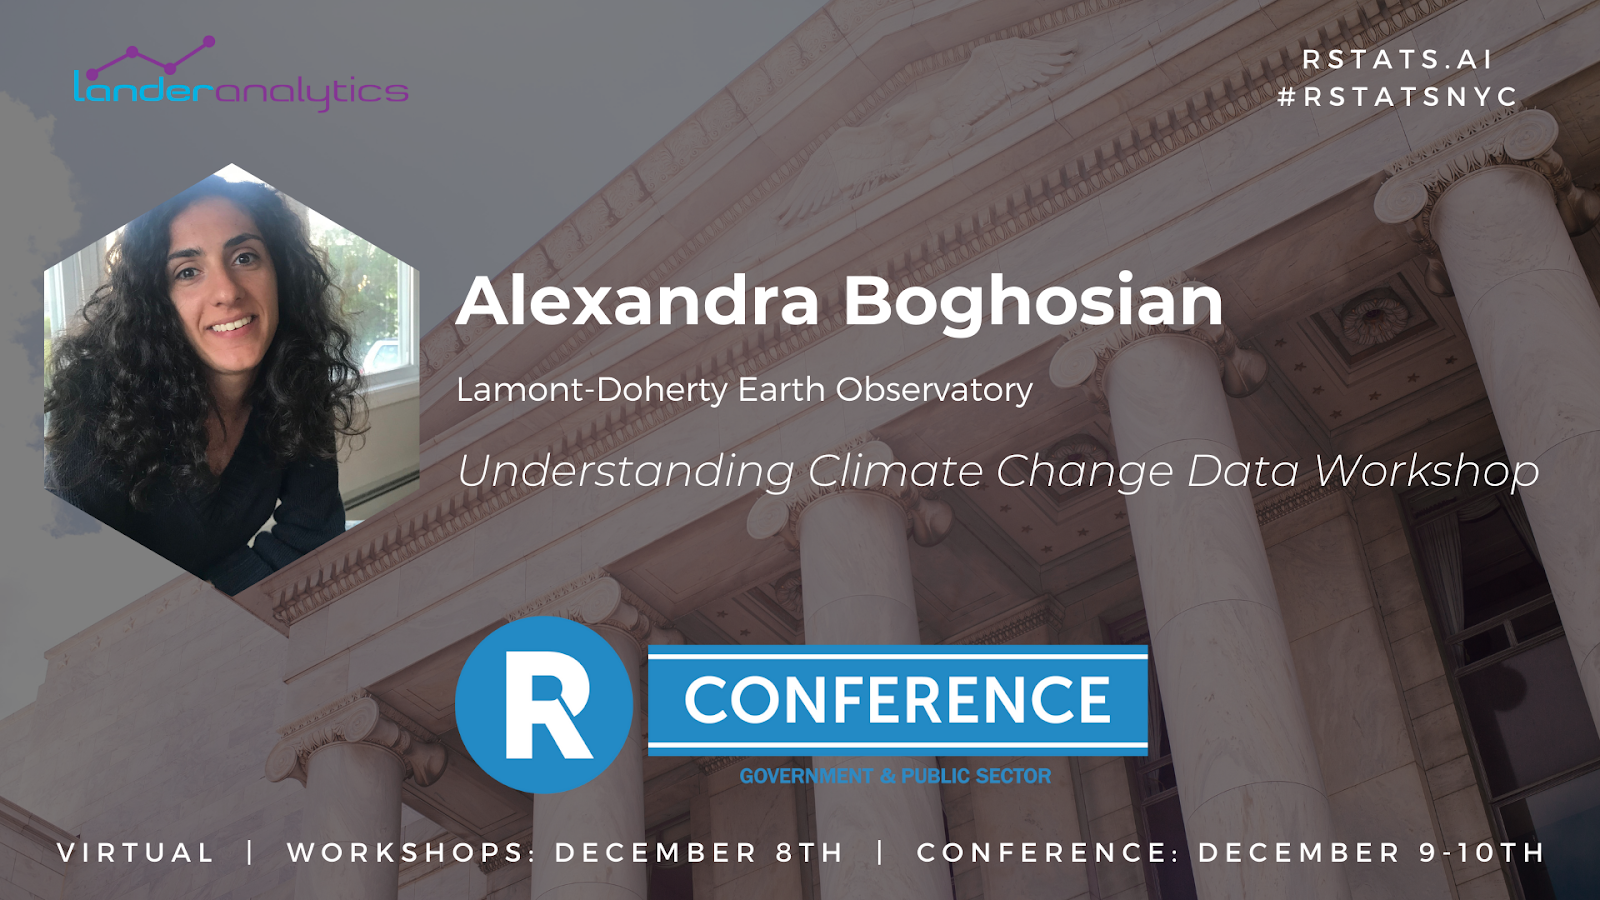
Alexandra, one of my former students, plans to take you through data analysis on climate change, by exploring publicly available datasets that you may or may not have known about. As Alexandra describes it, “by the end of the day, attendees should have a working knowledge of how the data support the science, and where to gather data and information about specific climate change issues they may face in their work.”
If a workshop on climate change is not right for you, my close friend Jonathan Hersh is giving his workshop on machine learning for public policy. Jonathan will lead you through applied machine learning exercises with a focus on the public space. The session will cover basic concepts like supervised vs. unsupervised learning, testing and training sets, and the bias-variance tradeoff. Jonathan will also review linear regression, ridge regression, cross-validation, and lasso regression. He will cover R Language and syntax, data manipulation in R, exploratory data analysis, and basic plotting in R.
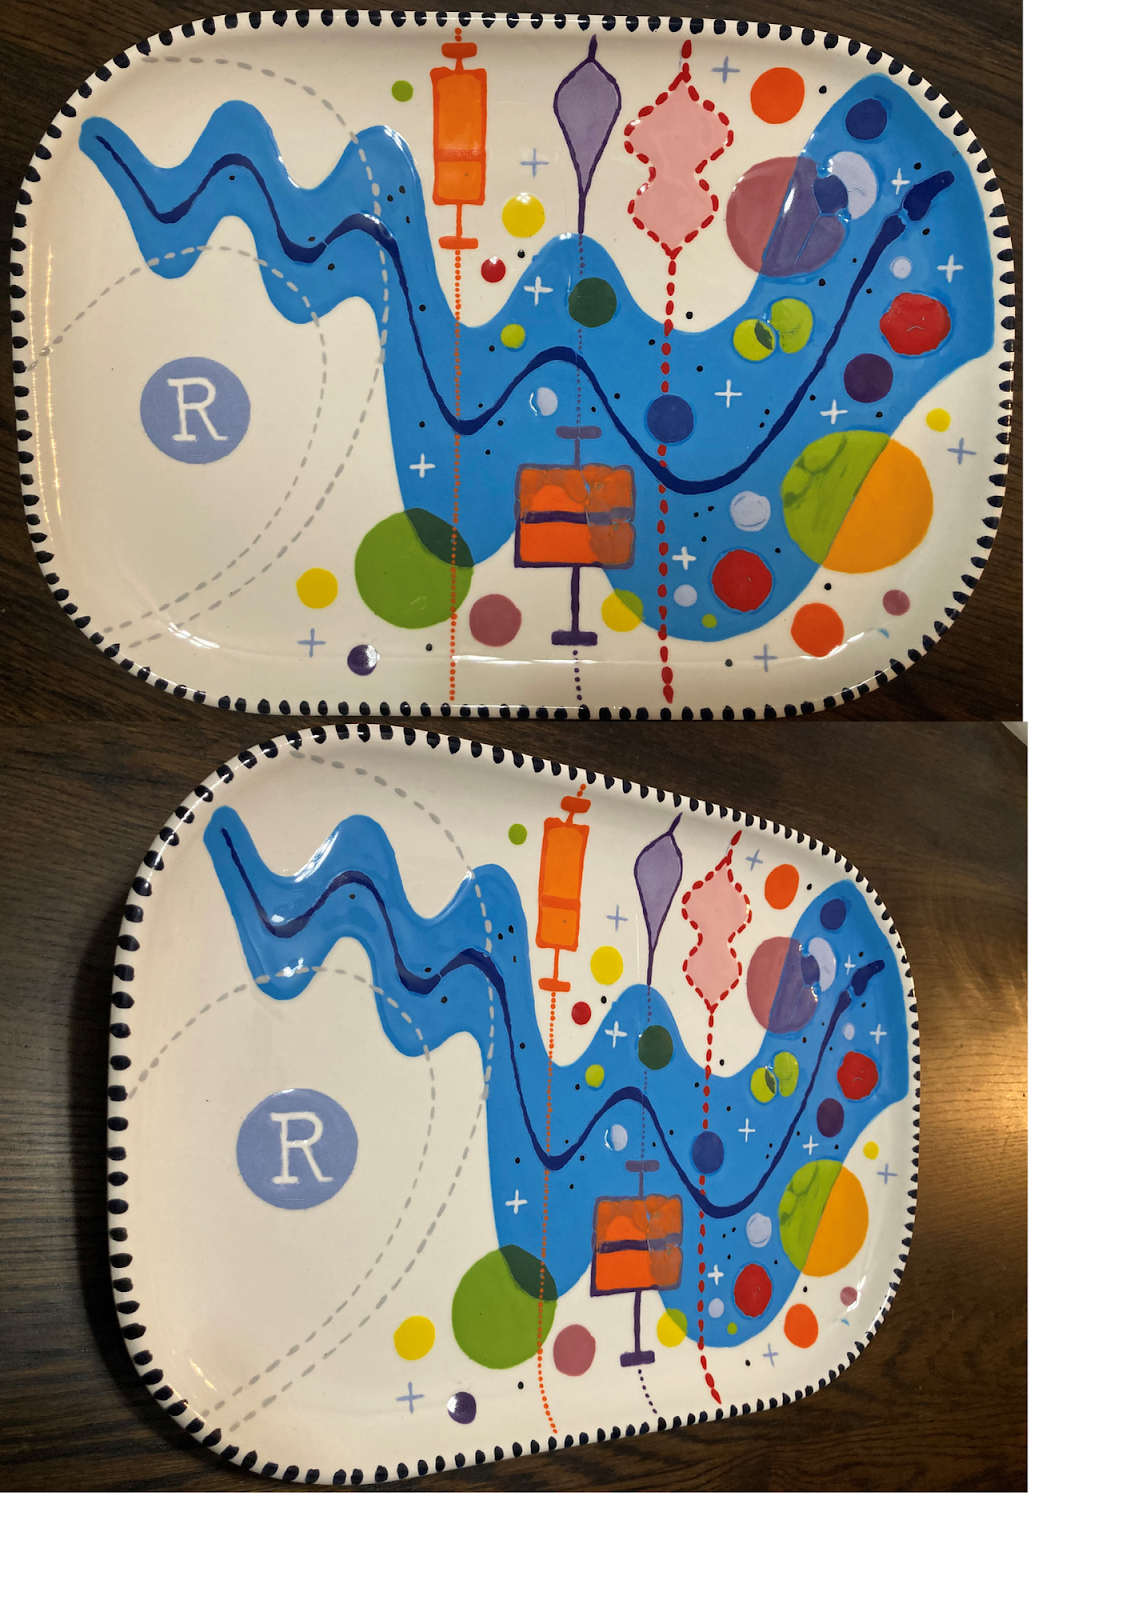
The aRt auction is back! The auction features pieces by artists from the R Community. All proceeds will be donated to the R Foundation, a not-for-profit organization committed to the continued development of R. Bidding will begin December 1st and winners will be announced December 10th in the afternoon during the conference!
I would like to extend a special thank you to my good friend, Marck Vaisman and the Data Community DC. This conference would not be possible without your continued support. And I thank you, Marck, for our close friendship over the years. It has been incredible to witness the growth of the meetup community right alongside you.
The additional support of RStudio, PolicyViz, the R Consortium and Pearson goes a long way to making this conference such an informative and fun event.
The inaugural Government & Public Sector R Conference took place virtually from December 2nd to December 4th. With over 240 attendees, 26 speakers, three panelists and a rum masterclass class leader, the R|Gov conference was a place where data scientists could gather remotely to explore, share, and inspire ideas.
Check out some of the highlights from the conference:
Graciela Chichilnisky explains how financial instruments can resolve climate change
One of my former professors at Columbia University, Dr. Graciela Chichilnisky, gave a presentation on how financial instruments can resolve climate change quickly and effectively by using existing capital markets to benefit high—and, especially, low—income groups. The process Dr. Chichilnisky proposes is simple and can lead to a transformation of our capitalistic economy in the direction of human survival. Furthermore, it is realistic and is profitable. Dr. Chichilnisky acted as the lead U.S. author on the Intergovernmental panel on Climate Change, which received the 2007 Nobel Prize for its work in deciding world policy with respect to climate change, and she worked extensively on the Kyoto Protocol, creating and designing the carbon market that became international law in 2005.
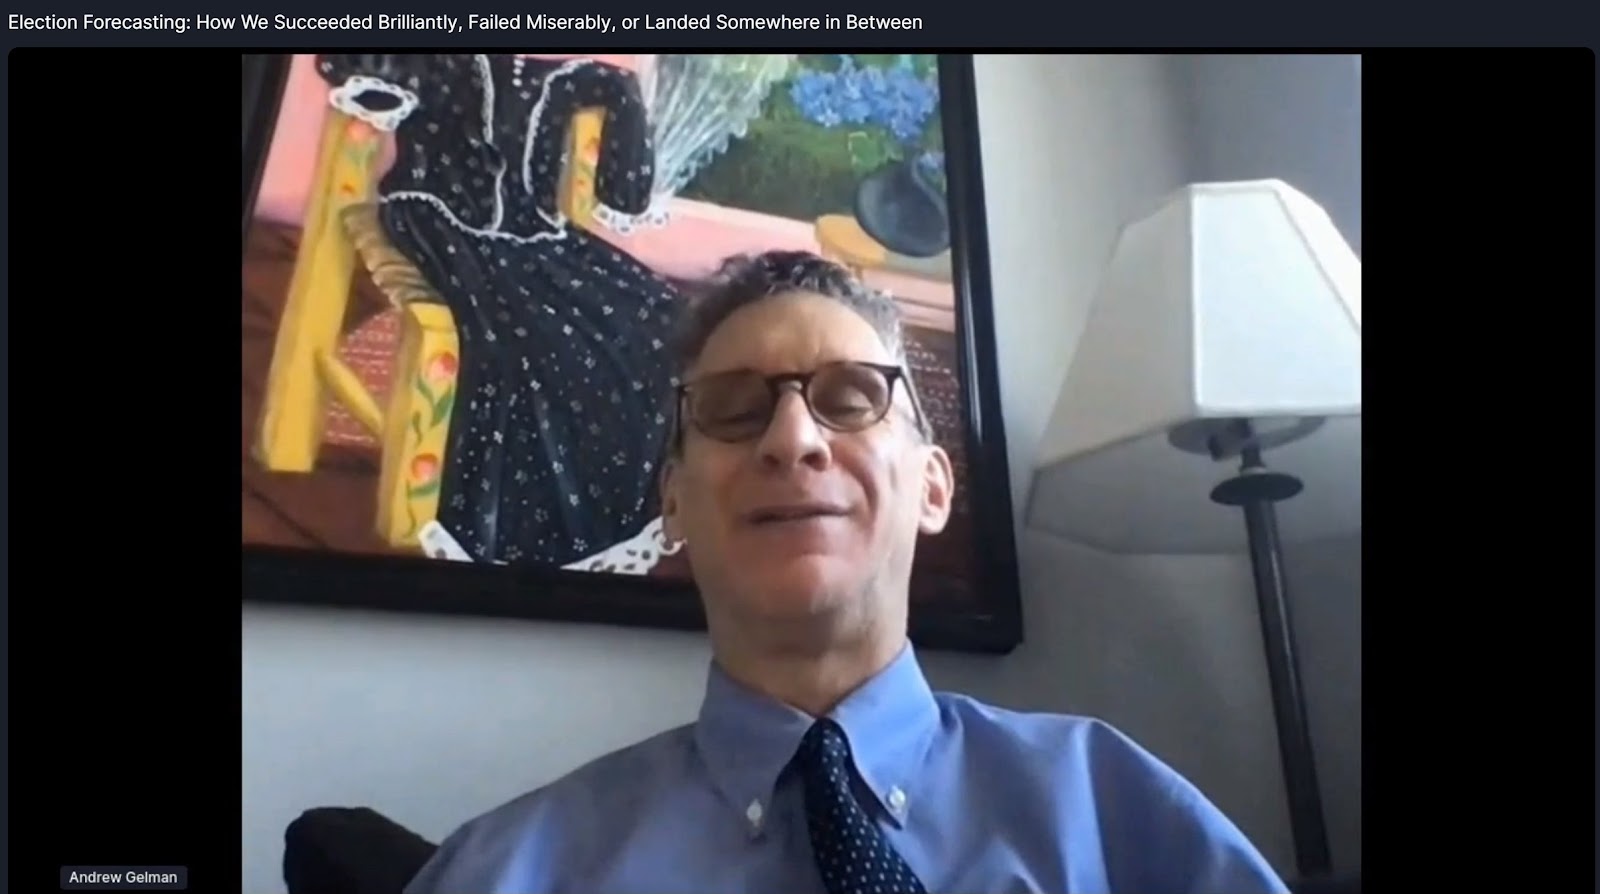
Another classic no-slides talk from Andrew Gelman on how his team and The Economist Magazine built a presidential election forecasting model
Another professor of mine, Andrew Gelman told us he wanted to give a talk on how his team’s election forecasting succeeded brilliantly, failed miserably, or landed somewhere in between. To build the model, they combined national polls, state polls, and political and economic fundamentals. Because we didn’t know the results of the election at the time, he didn’t know which of the three he’d be talking about… So how did his election forecast perform? The model predicted 49 out of 50 states correctly… But that doesn’t mean the forecast was perfect… For some background, see this article.
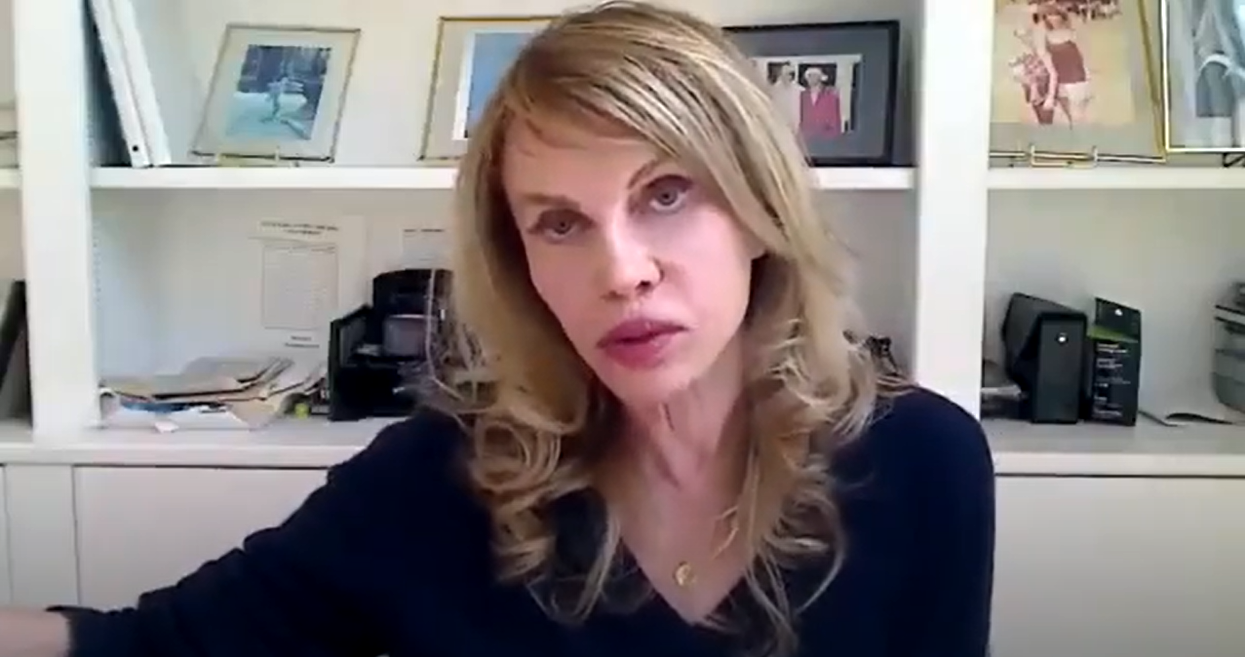
Wendy Martinez inspires and shares lessons about the rocky road she traveled to using R at a U.S. Government agency
Wendy Martinez described some of her experiences — both successes and failures — using R at several U.S. government agencies. In addition to serving as the Director of the Mathematical Statistics Research Center at the Bureau of Labor Statistics (BLS) for the last eight years, she is currently the President of the American Statistical Association (ASA), and she also served in several research positions throughout the Department of Defense. She has also written two books on MATLAB! It’s nice to see that she switched to open source.
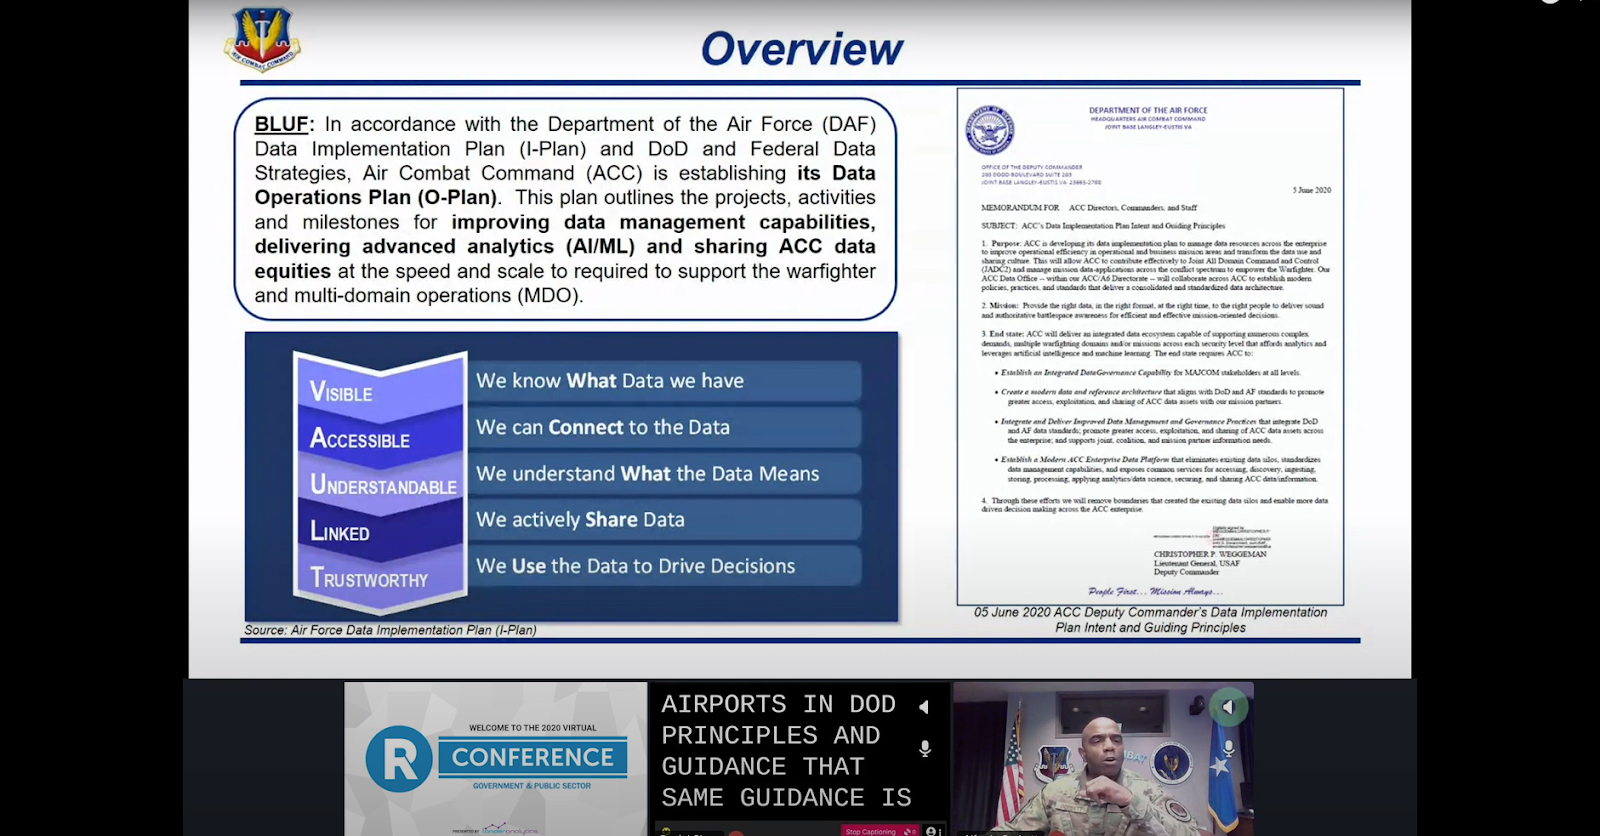
Colonel Alfredo Corbett Spoke On Air Combat Command Enterprise Data Improvements
Deputy Director of Communications of the United States Air Force Colonel Alfedo Corbett showed us why, in his work, data can be a warfighting asset, fundamental to how Air Combat Command (ACC) operates in—and supports—all domains of warfare. In coordination with the Department of Defense and the Department of the Air Force, ACC is working to improve its data governance, data architecture, data standards, and data talent & culture, implementing major improvements to the way it manages, acquires, ingests, stores, processes, exploits, analyzes, and delivers data to its almost 100,000 operators.
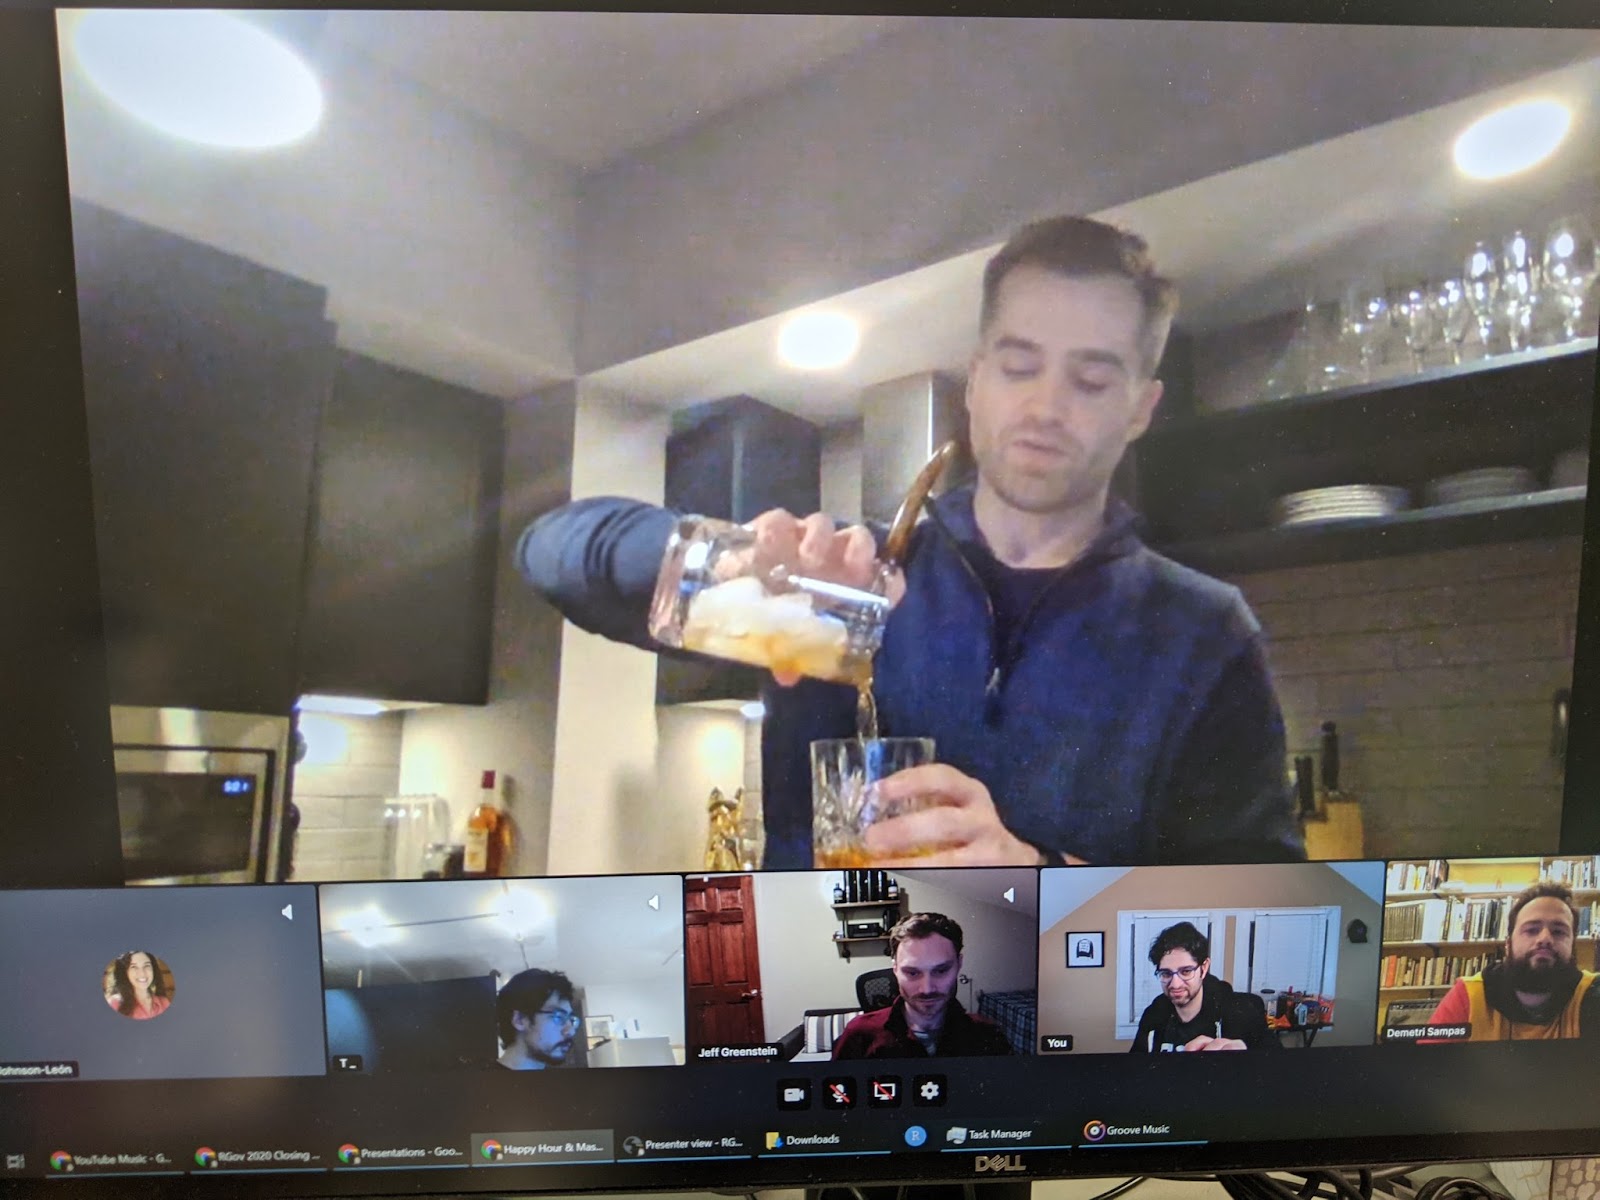
We Participated in Two Virtual Happy Hours!
At lunch on the first day of the conference, we took a dive into the history and distillation process of a legendary rum made at the longest continuously running distillery in the world, Mount Gay Brand Ambassador Darrio Prescod shared his knowledge and transported us to Barbados (where he tuned in from virtually). Following the second day of the conference, members of the Mount Gay brand development team took us through a rum tasting and shook up a couple of cocktails. Attendees and speakers listened and hung out, drinking rum, matcha, soda or water during our virtual happy hour.
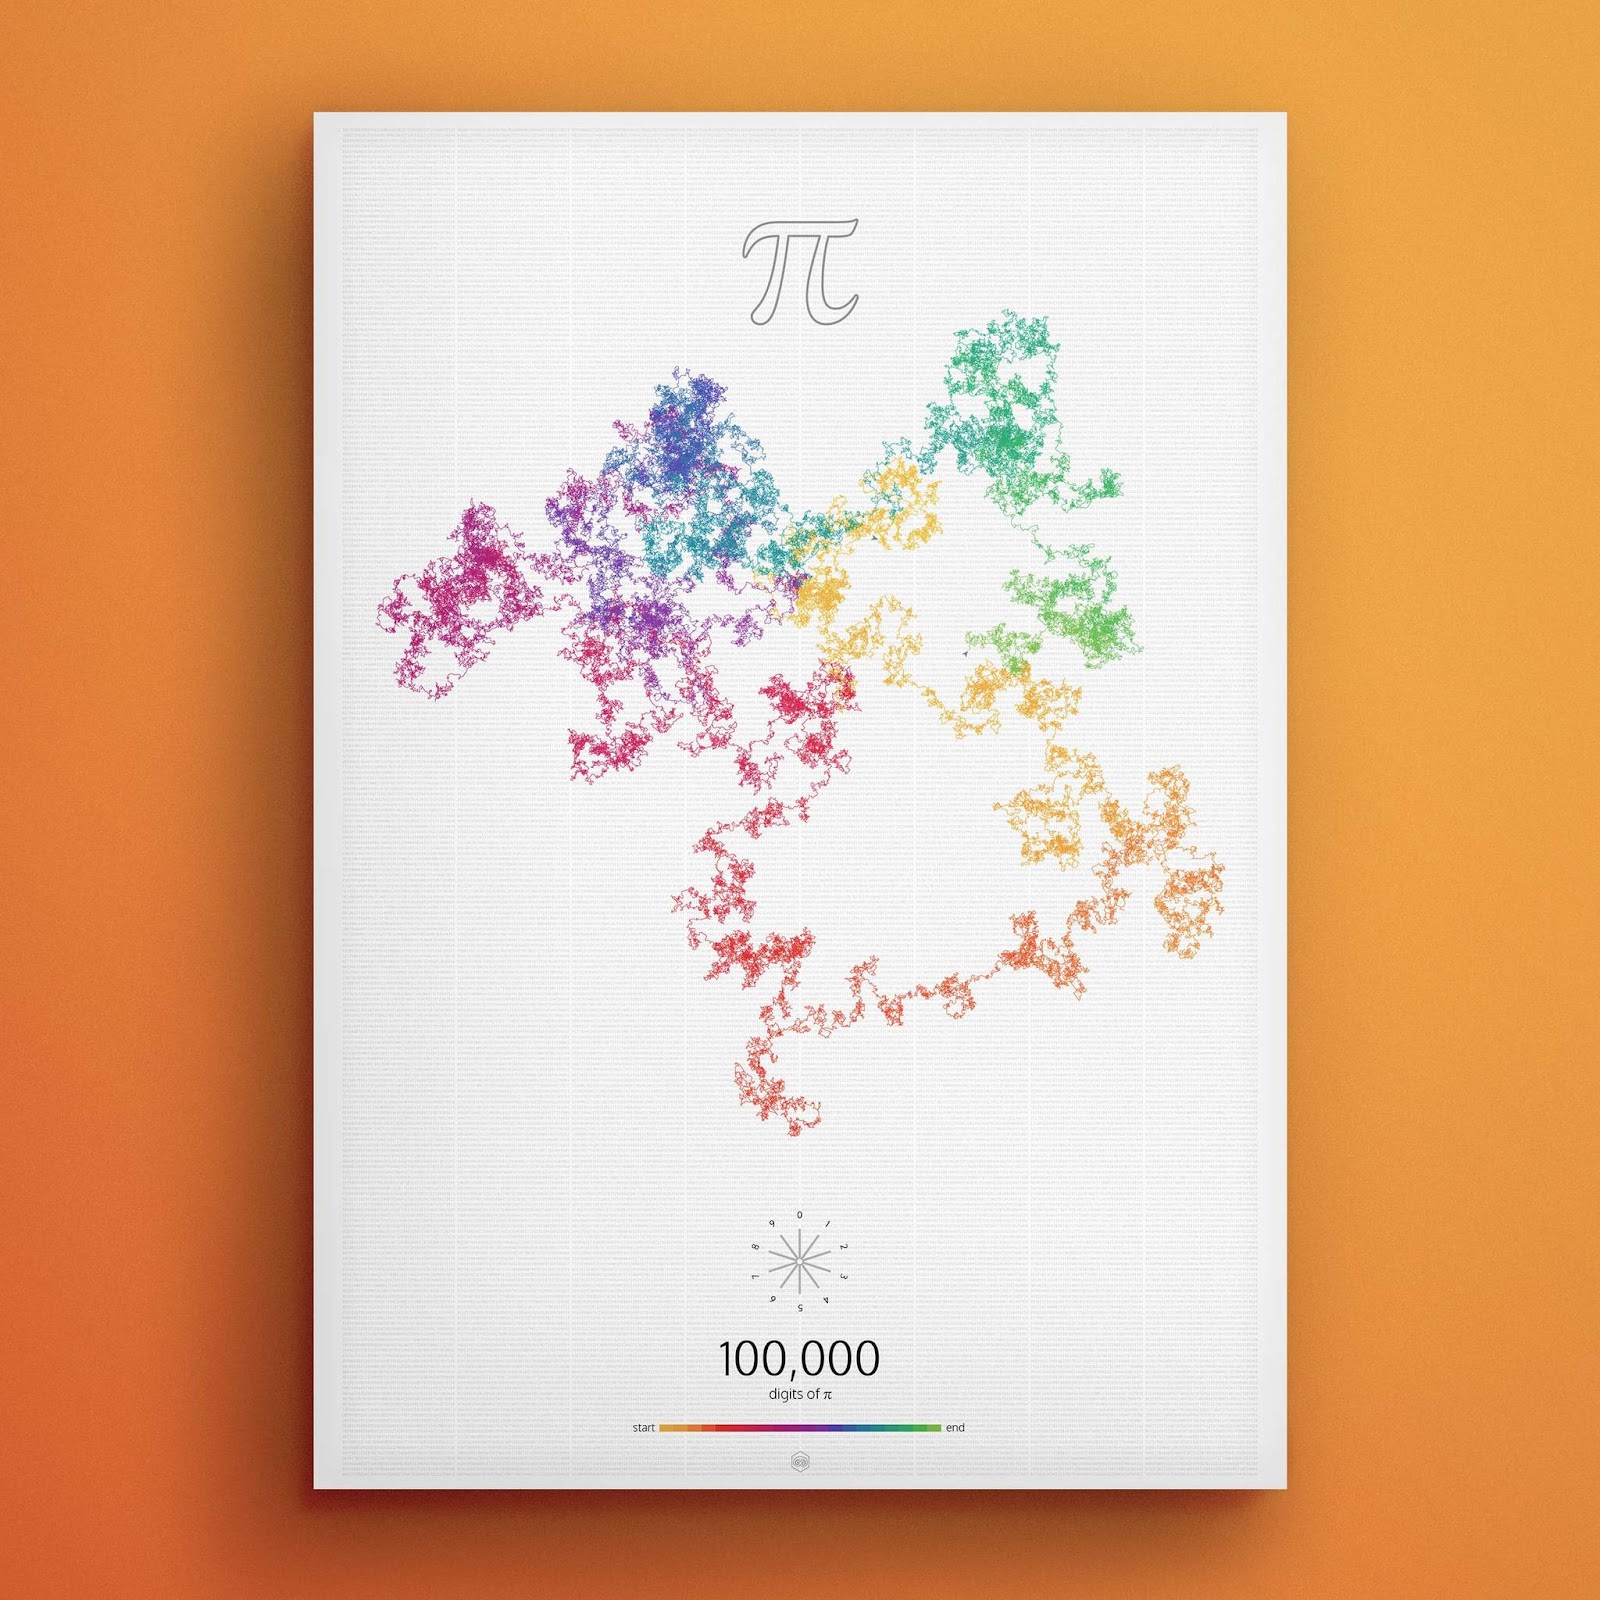
All proceeds from the A(R)T Auction went to the R Foundation
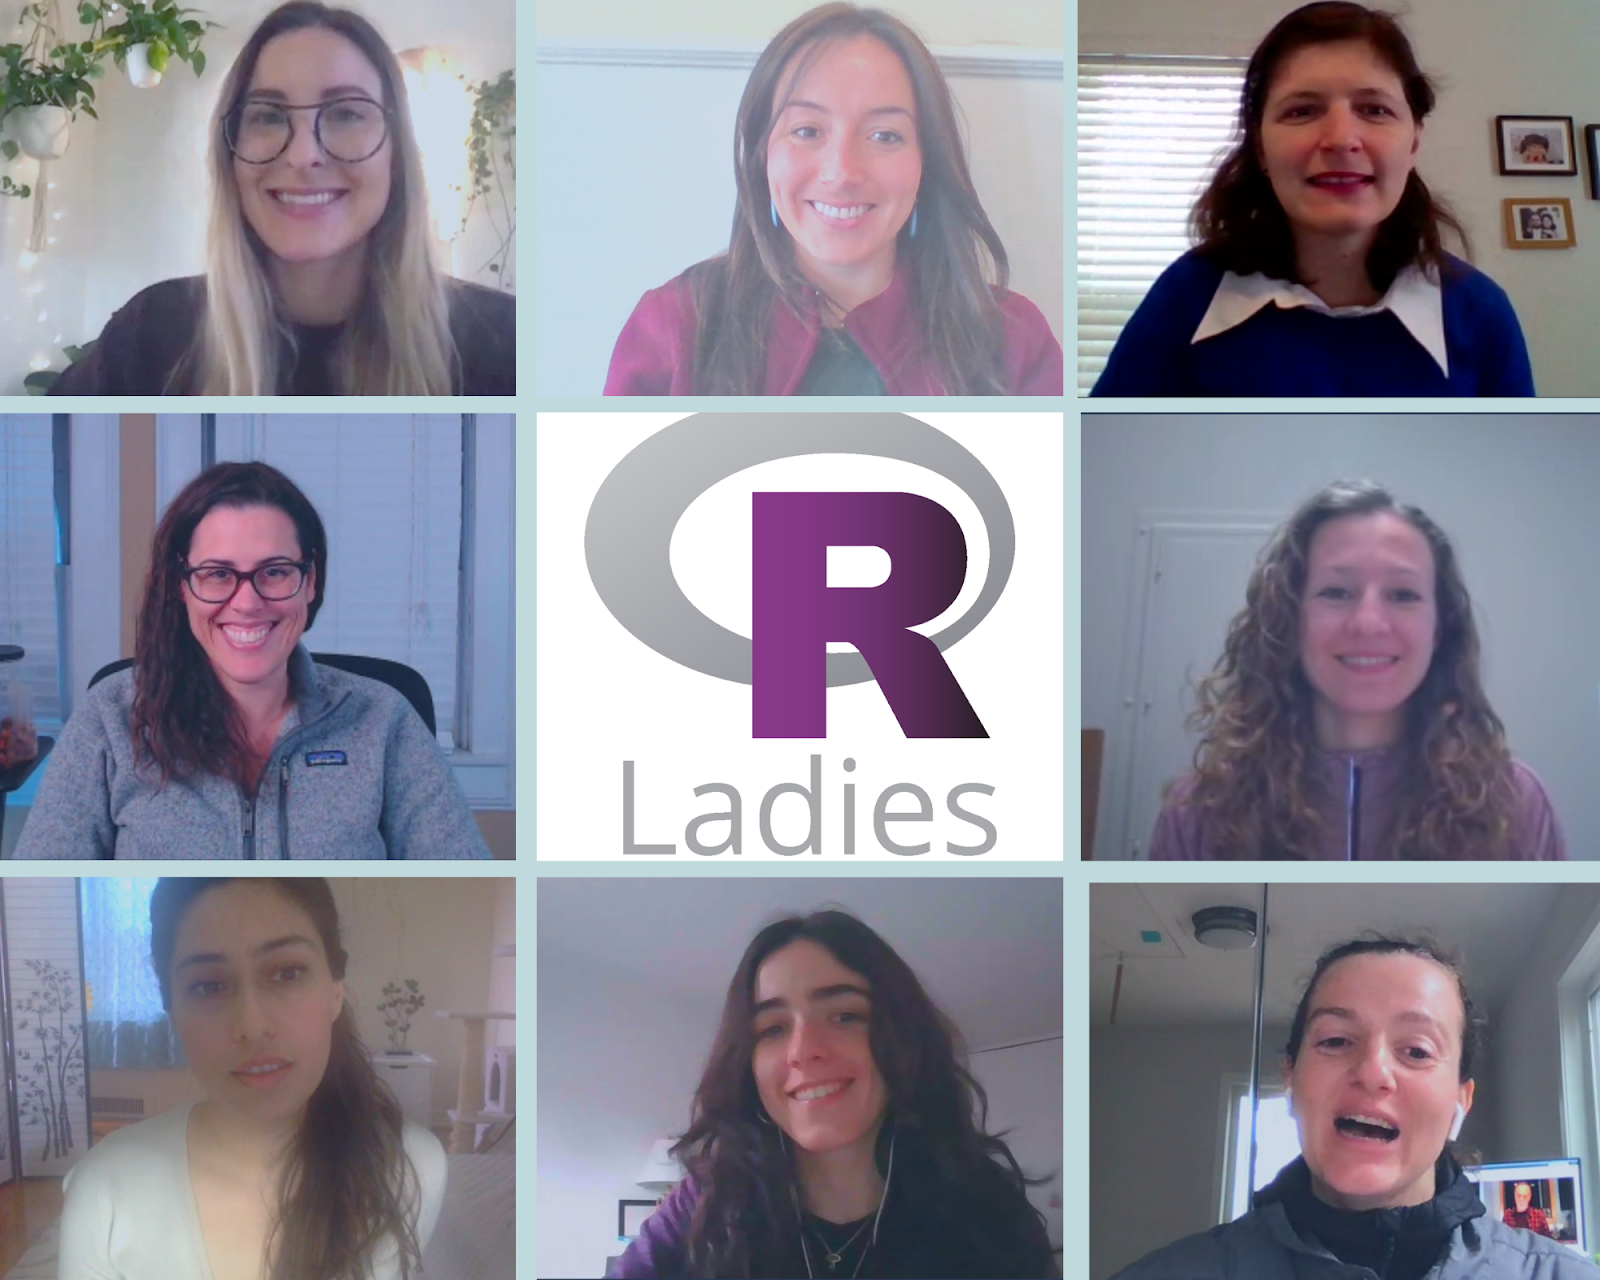
We took an R-Ladies group [virtual] selfie. We would like to note that more R-Ladies participated, but chose not to share video.:
Jon Harmon, Selina Carter, Mayarí Montes de Oca & DiKayo Data win Raspberry Pis, Noise Cancelling Headphones, and Gaming Mechanical Keyboards for Most Active Tweeting You can see the R|Gov 2020 R Shiny Scoreboard here! A custom started at DCR 2018 by our Twitter scorekeeper Malorie Hughes (@data_all_day), has returned every year by popular demand. Congratulations to our winners!
52 Conference Attendees Participated in Pre-Conference Workshops
We ran the following workshops prior to the conference:
Geospatial Statistics and Mapping in R with Kaz Sakamoto
Introduction to Machine Learning for Public Policy with Jonathan Hersh
Moving from DCR to R|Gov With the shift to remote, we realized we could welcome a global audience to our annual conference, as we did for the virtual New York R Conference in August. And that gave birth to R|Gov, the Government and Public Sector R Conference. This new industry-focused conference focused on work in government, defense, NGOs and the public sector, and we have speakers from not only the DC-area, but also from Geneva, Switzerland, Nashville, Tennessee, Quebec, Canada and Los Angeles, California. For next year, we are working to invite speakers from more levels of government–local, state and federal. You can read more about this choice here.
Like NYR, R|Gov featured many in-person components of the gathering, like networking sessions, speaker walk-on songs and fun facts, happy hours, lots of giveaways, the Twitter contest, and the auction.
Thank you, Lander Analytics Team!
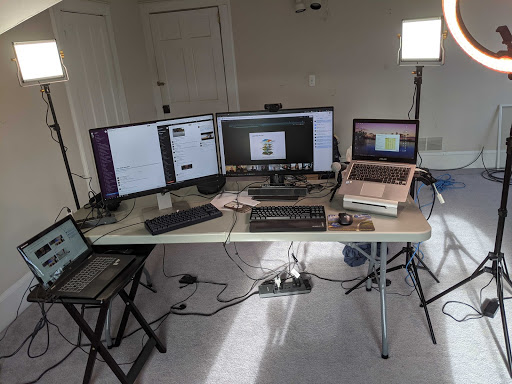
Even though it was virtual, there was a lot of work that went into the conference, and I want to thank my amazing team at Lander Analytics along with our producer, Bill Prickett, for making it all come together.
Looking Forward to New York, R|Gov, and Dublin!
If you attended, we hope you had an incredible experience. If you did not attend this year’s conference, we hope to see you at the at the New York R Conference and R|Gov in 2021, and, soon, the first Dublin R Conference.
My team at Lander Analytics has been putting together conferences for six years, and they’ve always had the same fun format, which the community has really enjoyed. There’s the NYR conference for New Yorkers and those who want to fly, drive or train to join the New York community, and there’s DCR, which gathers the DC-area community. The last DCR Conference at Georgetown University went really well, as you can see in this recap. With the shift to virtual gatherings brought on by the pandemic, our community has gone fully remote, including the monthly Open Statistical Programming Meetup. With that, we realized the DCR Conference didn’t just need to be for folks from the DC-area anymore, instead, we could welcome a global audience like we did with this year’s NYR. And that gave birth to R|Gov, the Government and Public Sector R Conference.
R|Gov is really a new industry-focused conference. Instead of drawing on speakers from a particular city or area, the talks will focus on work done in specific fields. In this case, in government, defense, NGOs and the public sector, and we have speakers from not only the DC-area, but also from Geneva, Switzerland, Nashville, Tennessee, Quebec, Canada and Los Angeles, California. For the last three years, we have been working with Data Community DC, R-Ladies DC, and the Statistical Programming DC Meetup, to put on DCR, and continue to do so for R|Gov as we find great speakers and organizations who want to collaborate in driving attendance and building the community.
Like NYR and DCR, the topics at R|Gov range from practical how-tos, to theoretical findings, to processes, to tooling and the speakers this year come from the Center for Army Analysis, NASA, Columbia University, The U.S. Bureau of Labor Statistics, the Inter-American Development Bank, The United States Census Bureau, Harvard Business School, In-Q-Tel, Virginia Tech, Deloitte, NYC Department of Health and Mental Hygiene and Georgetown University, among others. We will also be hosting two rum and gin master classes, including one with Mount Gay, which comes from the oldest continuously running rum distillery in the world, and which George Washington served at his inauguration!
The R Conference series is quite a bit different from other industry and academic conferences. The talks are twenty minutes long with no audience questions with the exception of special talks from the likes of Andrew Gelman or Hadley Wickham. Whether in person or virtual, we play music, have prize giveaways and involve food in the programming. When they were in person, we prided ourselves on avocado toast, pizza, ice cream and beer. For prizewinners, we autographed books right on stage since the authors were either speakers or in the audience. With the virtual events we try to capture as much of that spirit as possible, and the community really enjoyed the virtual R Conference | NY in August. A very lively event remotely and in the flesh, it is also one of the more informative conferences I have ever seen.
This virtual conference will include much of the in-person format, just recreated virtually. We will have 24 talks, a panel, workshops, community and networking breaks, happy hours, prizes and giveaways, a Twitter Contest, Meet the Speaker series, Job Board access, and participation in the Art Auction. We hope to see you there December 2-4, on a comfy couch near you.
The sixth annual (and first virtual) “New York” R Conference took place August 5-6 & 12-15. Almost 300 attendees, and 30 speakers, plus a stand-up comedian and a whiskey masterclass leader, gathered remotely to explore, share, and inspire ideas.
Let’s take a look at some of the highlights from the conference:
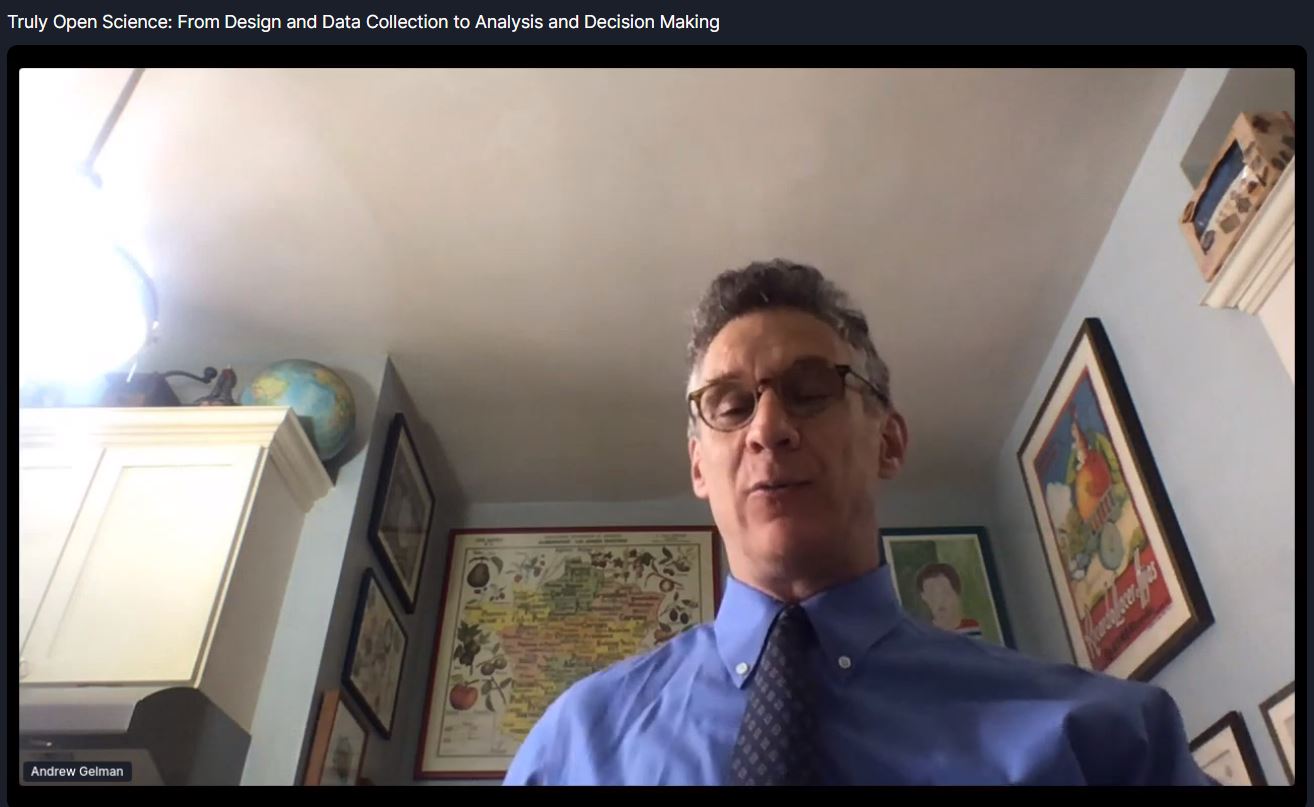
Andrew Gelman Gave Another 40-Minute Talk (no slides, as always)
Our favorite quotes from Andrew Gelman’s talk, Truly Open Science: From Design and Data Collection to Analysis and Decision Making, which had no slides, as usual:
“Everyone training in statistics becomes a teacher.”
“The most important thing you should take away — put multiple graphs on a page.”
“Honesty and transparency are not enough.”
“Bad science doesn’t make someone a bad person.”
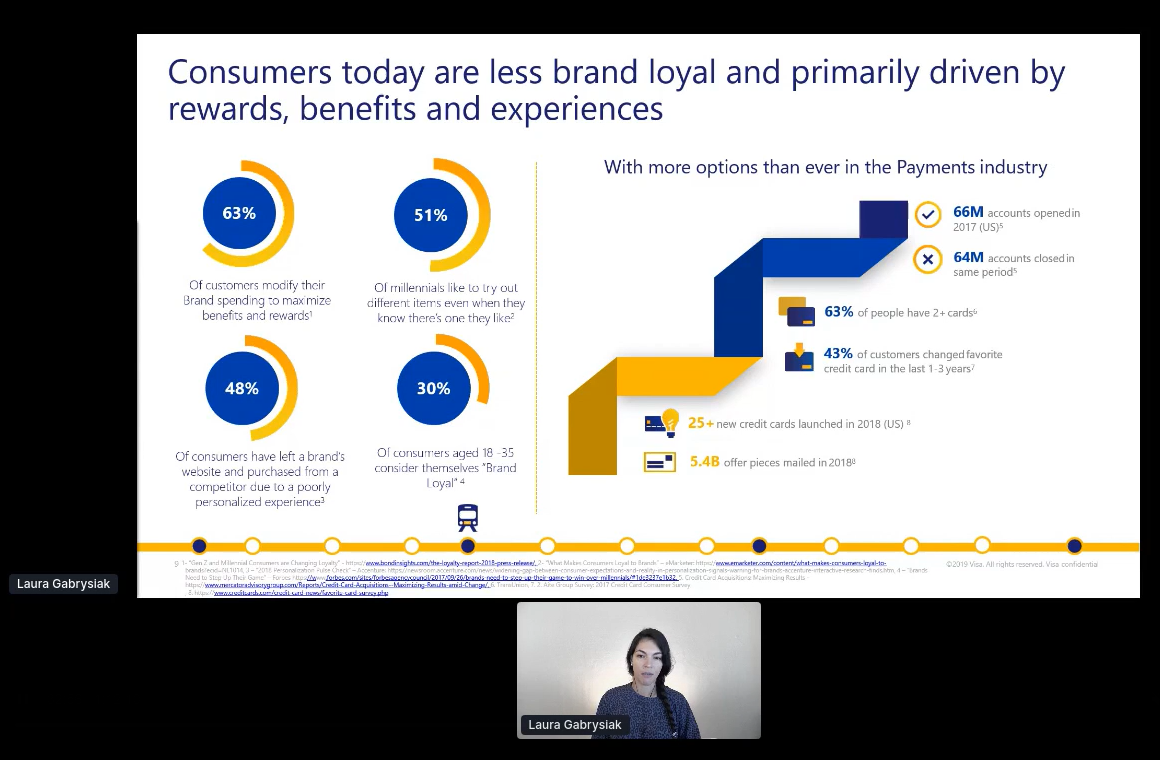
Laura Gabrysiak Shows us We Are Driven By Experience, and not Brand Loyalty…Hope you Folks had a Good Experience!
Laura’s talk on re-Inventing customer engagement with machine learning went through several interesting use cases from her time at Visa. In addition to being a data scientist, she is an active community organizer and the co-founder of R-Ladies Miami.
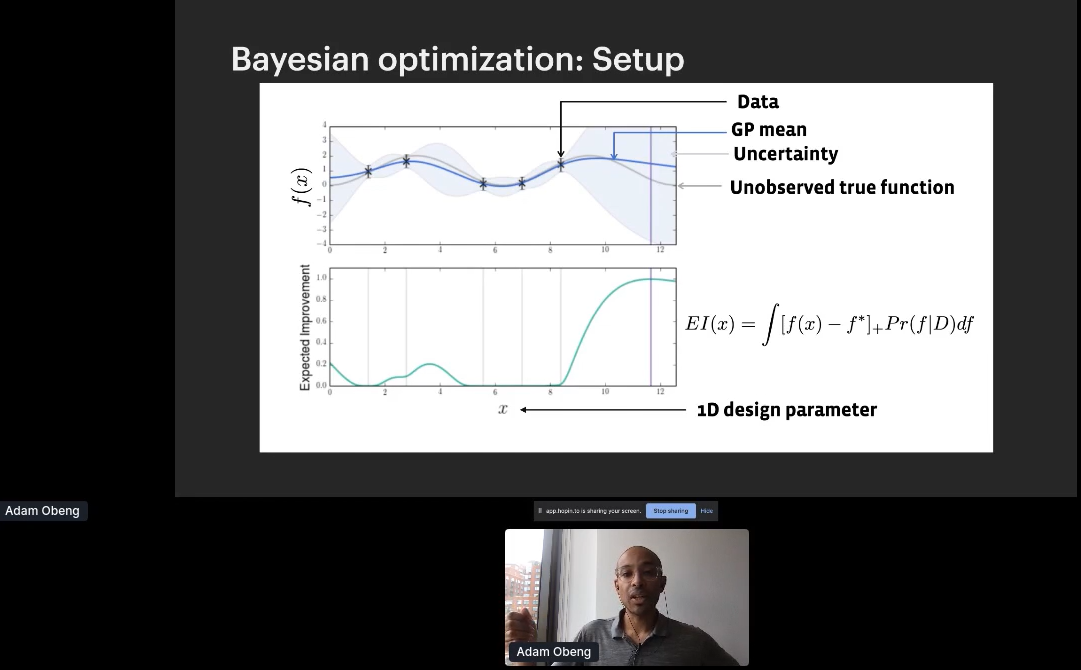
Adam Obeng Delivered a Talk on Adaptive Experimentation
One of my former students at Columbia University, Adam Obeng, gave a great presentation on his adaptive experimentation. We learned that adaptive experimentation is three things: The name of (1) a family of techniques, (2) Adam’s team at Facebook, and (3) an open source package produced by said team. He went through the applications which are hyper-parameter optimization for ML, experimentation with multiple continuous treatments, and physical experiments or manufacturing.
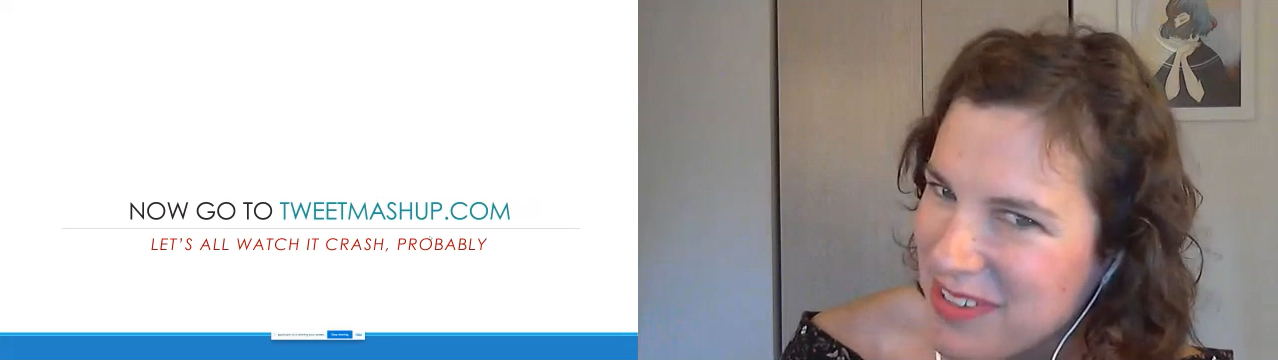
Dr. Jacqueline Nolis Invited Us to Crash Her Viral Website, Tweet Mashup
Jacqueline asked the crowd to crash her viral website,Tweet Mashup, and gave a great talk on her experience building it back in 2016. Her website that lets you combine the tweets of two different people. After spending a year making it in .NET, when she launched the site it became an immediate sensation. Years later, she was getting more and more frustrated maintaining the F# code and decided to see if I could recreate it in Shiny. Doing so would require having Shiny integrate with the Twitter API in ways that hadn’t been done by anyone before, and pushing the Twitter API beyond normal use cases.
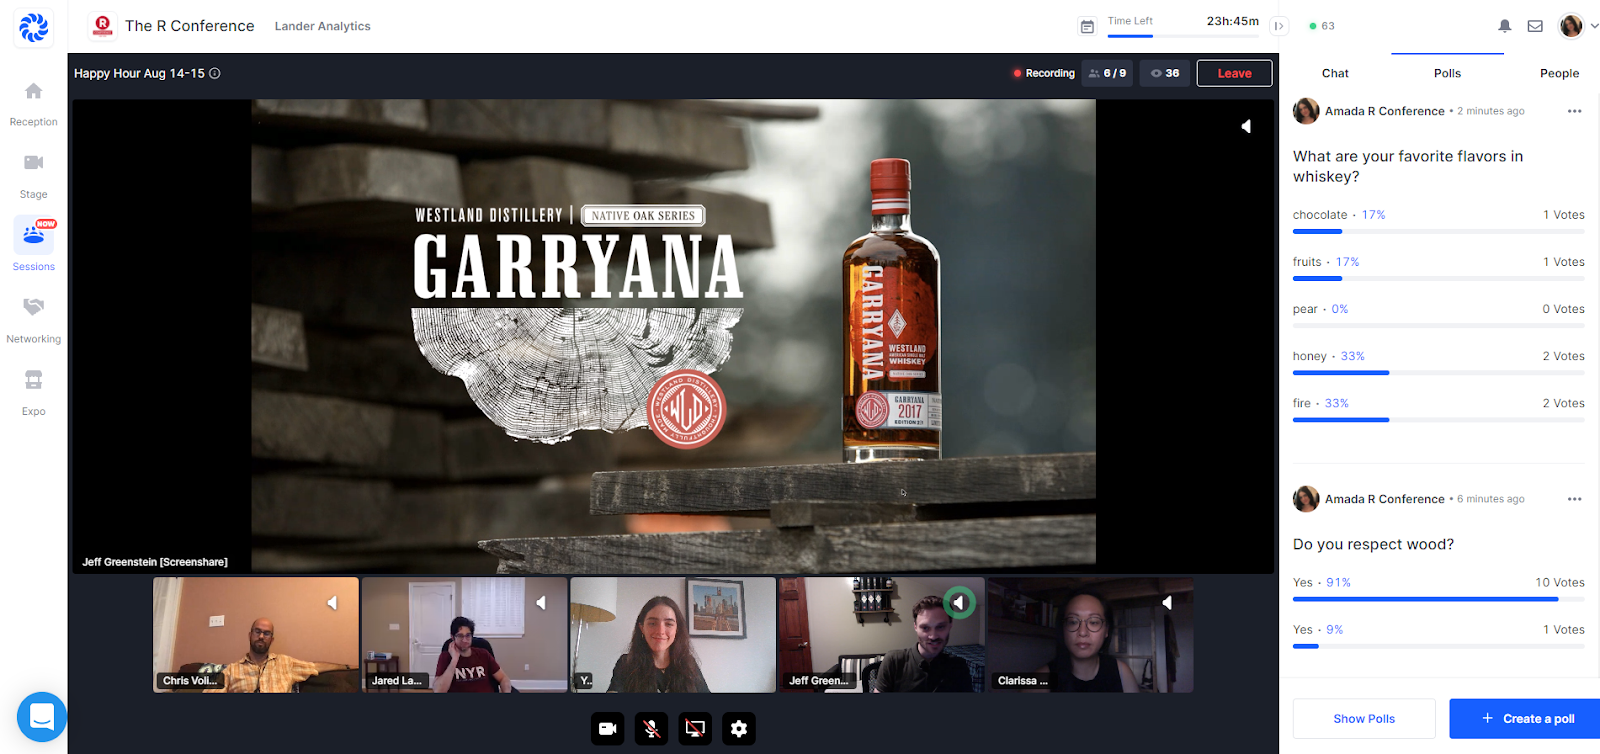
Attendees Participated in Two Virtual Happy Hours Packed with Fun
At the Friday Happy Hour, we had a mathematical standup comedian for the first time in R Conference history. Comic and math major Rachel Lander (no relationship to me!) entertained us with awesome math and stats jokes.
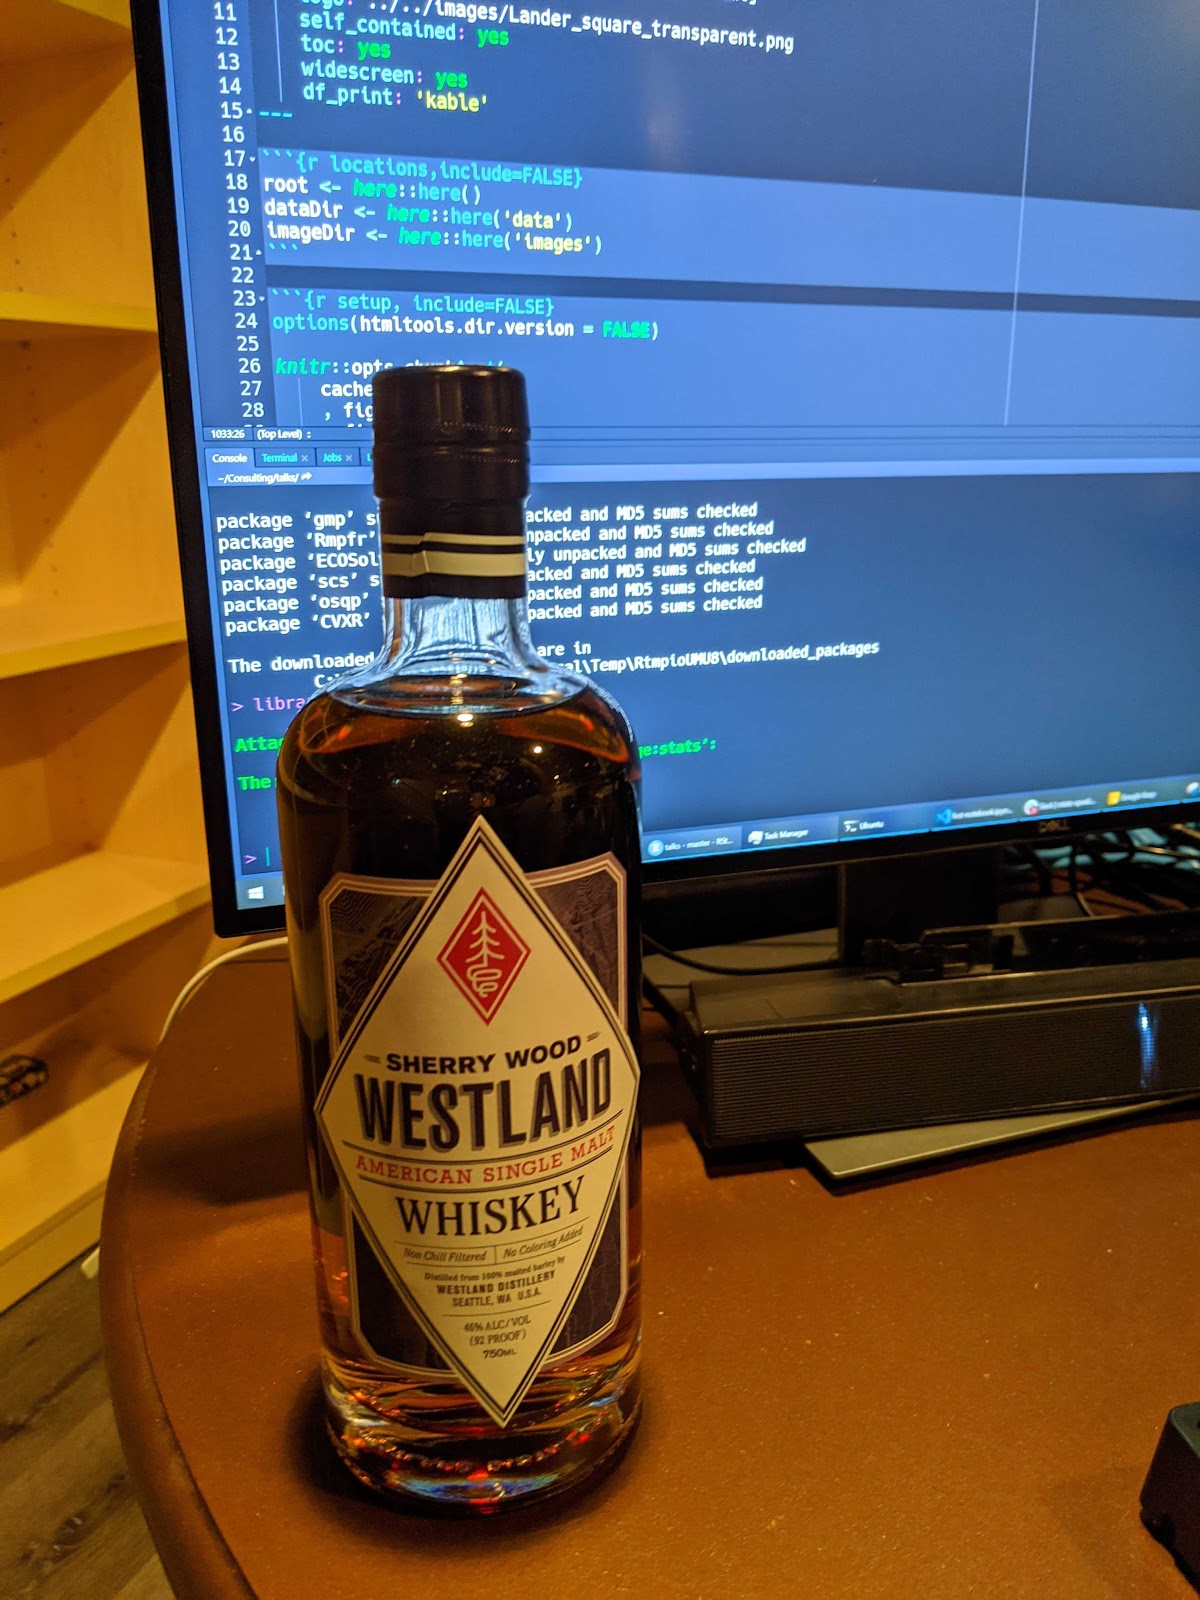
Following the stand up, we had a Whiskey Master Class with our Vibe Sponsor Westland Distillery, and another one on Saturday with Bruichladdich Distillery (hard to pronounce and easy to drink). Attendees and speakers learned and drank together, whether it be their whiskey, matchas, soda or water.
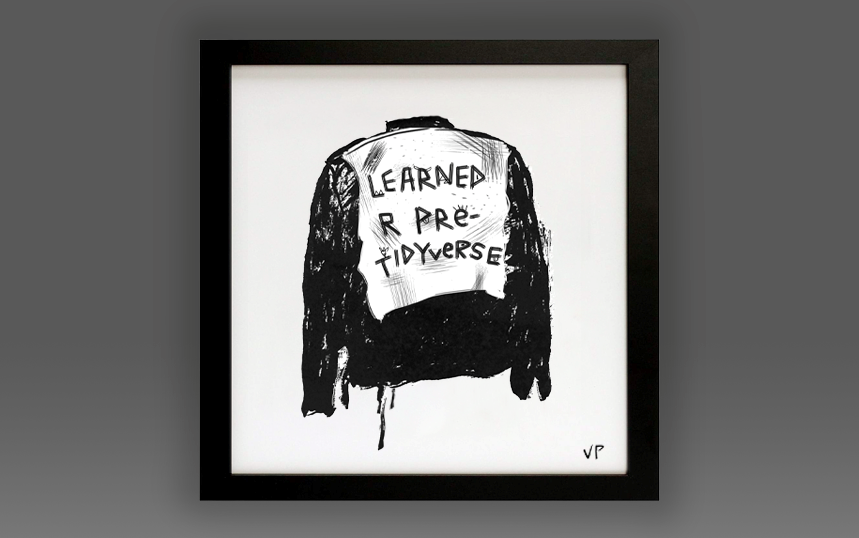
All Proceeds from the A(R)T Auction went to the R Foundation Again
A newer tradition, the A(R)T Auction, took place again! We featured pieces by artists in the R Community, and all proceeds were donated to the R Foundation. The highest-selling piece at auction was Street Cred (2020) by Vivian Peng (Lander Analytics and Los Angeles Mayor’s Office, Innovation Team). The second highest was a piece by Jacqueline Nolis (Brightloom, and Build a Career in Data Science co-author), R Conference speaker, Designed by Allison Horst, artist in residence at RStudio.
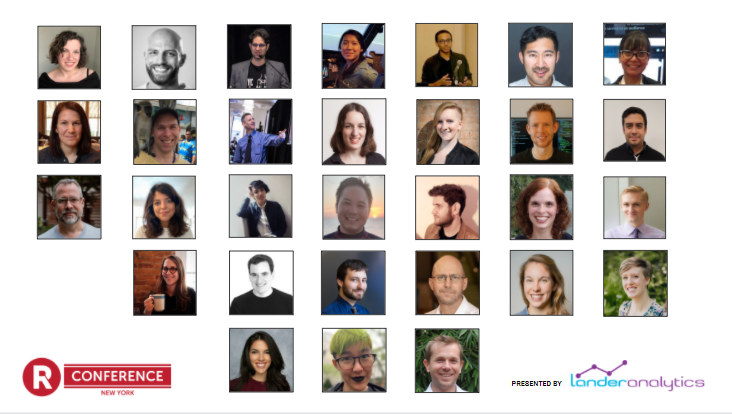
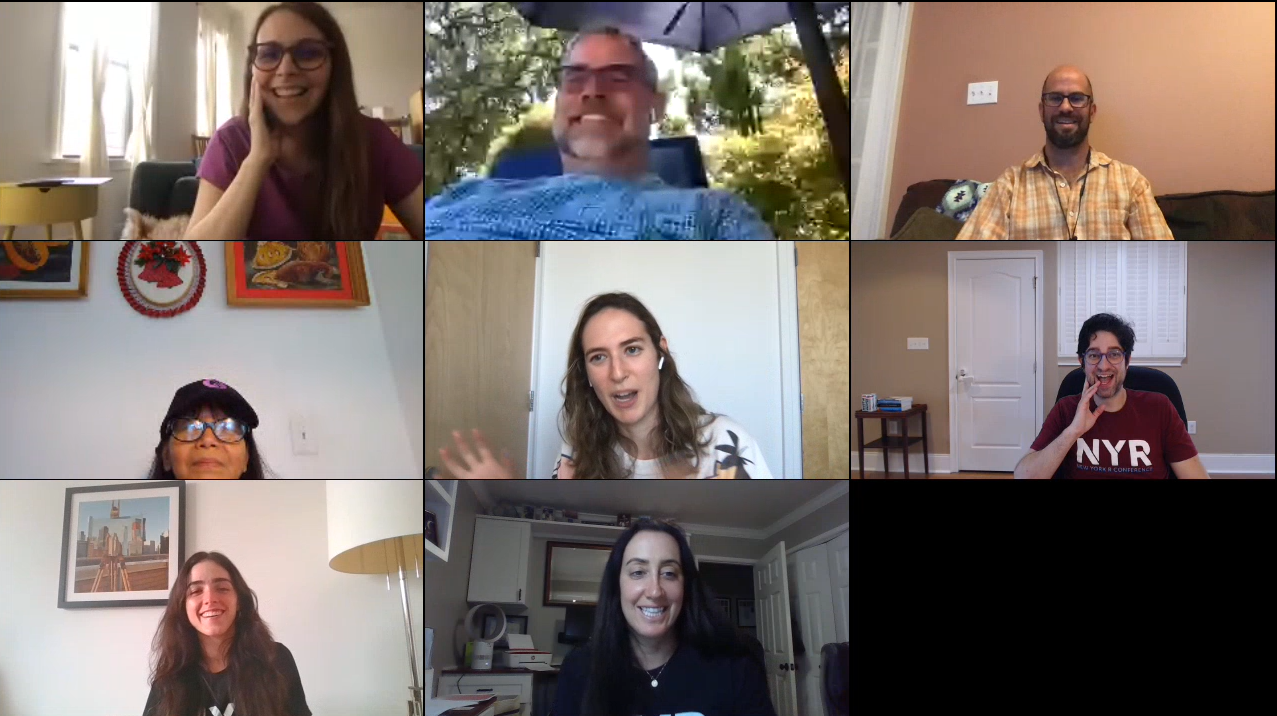
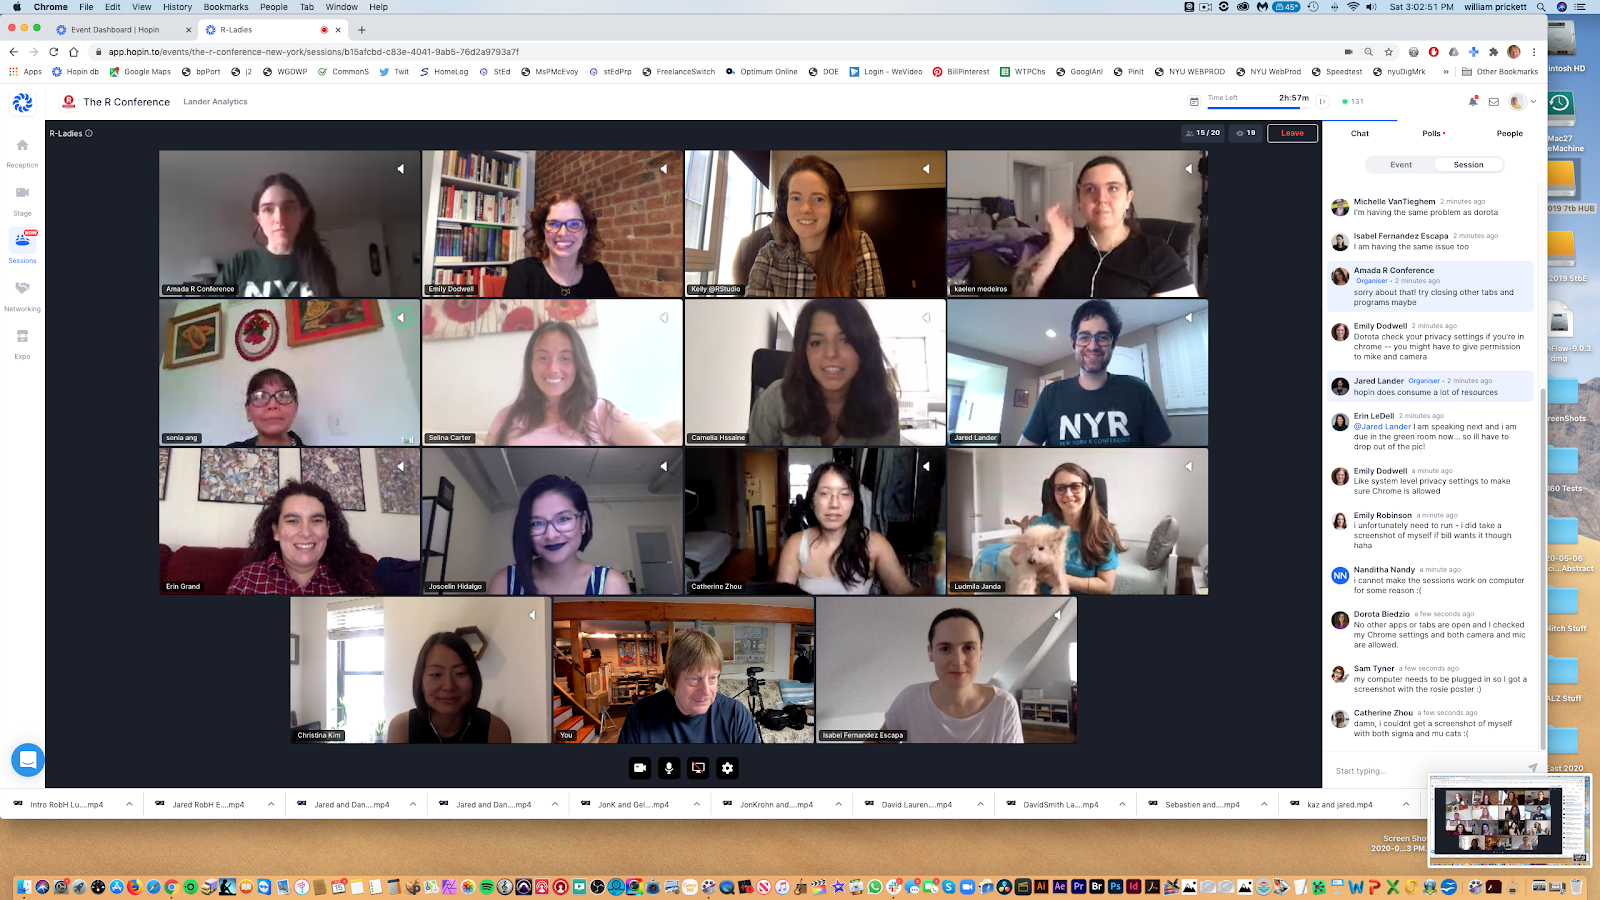
The R-Ladies Group Photo Happened, Even Remotely!
As per tradition, we took an R-Ladies group photo, but, for the first time, remotely– as a screenshot! We would like to note that many more R-Ladies were present in the chat, but just chose not to share video.
Jon Harmon, Edna Mwenda, and Jessica Streeter win Raspberri Pis, Bluetooth Headphones, and Tenkeyless Keyboards for Most Active Tweeting During the Conference
This year’s Twitter Contest, in Malorie’s words, was a “ruthless but noble war.” You can see the NYR 2020 Dashboard here. A custom started that DCR 2018 by our Twitter scorekeeper Malorie Hughes (@data_all_day) has returned every year by popular demand, and now she’s stuck with it forever! Congratulations to our winners!
50+ Conference Attendees Participated in Pre-Conference Workshops Before
For the first time ever, workshops took place over the course of several days to promote work-life balance, and to give attendees the chance to take more than one course. We ran the following seven workshops:
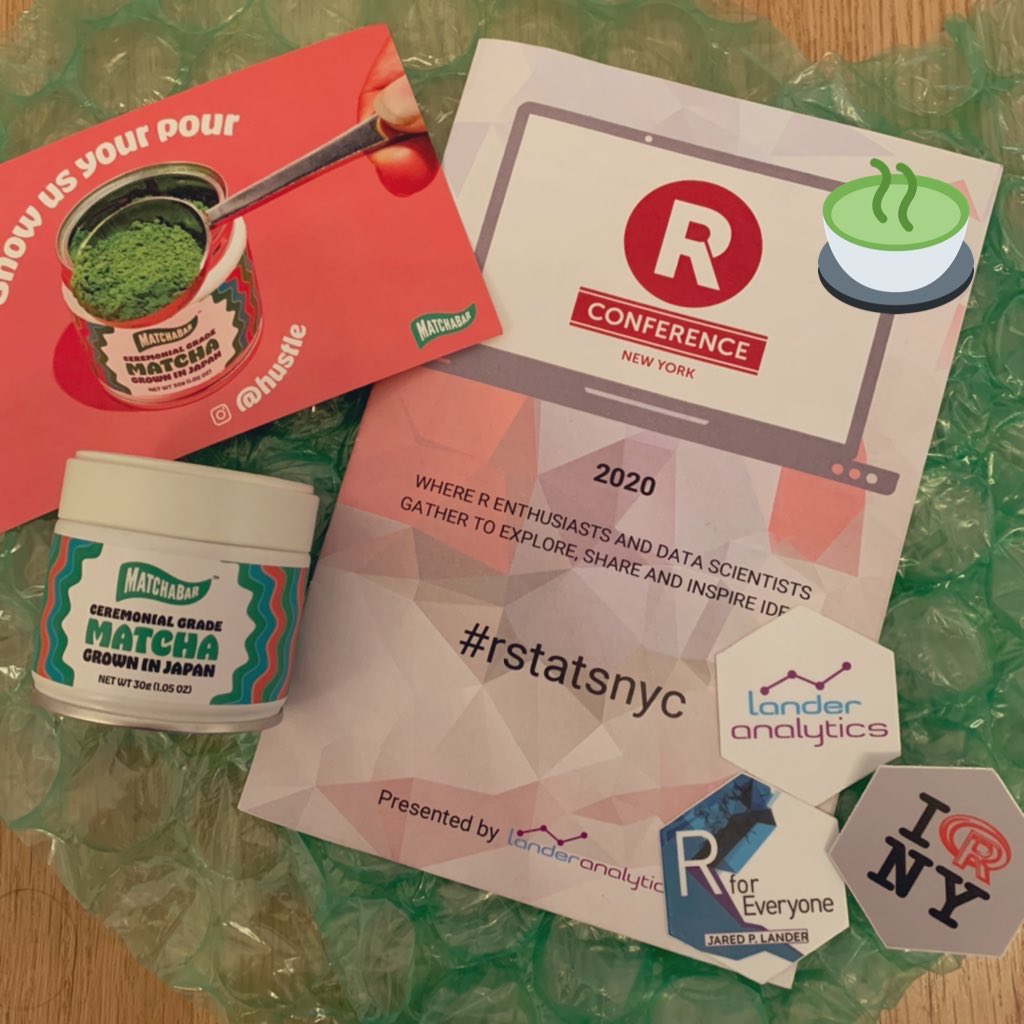
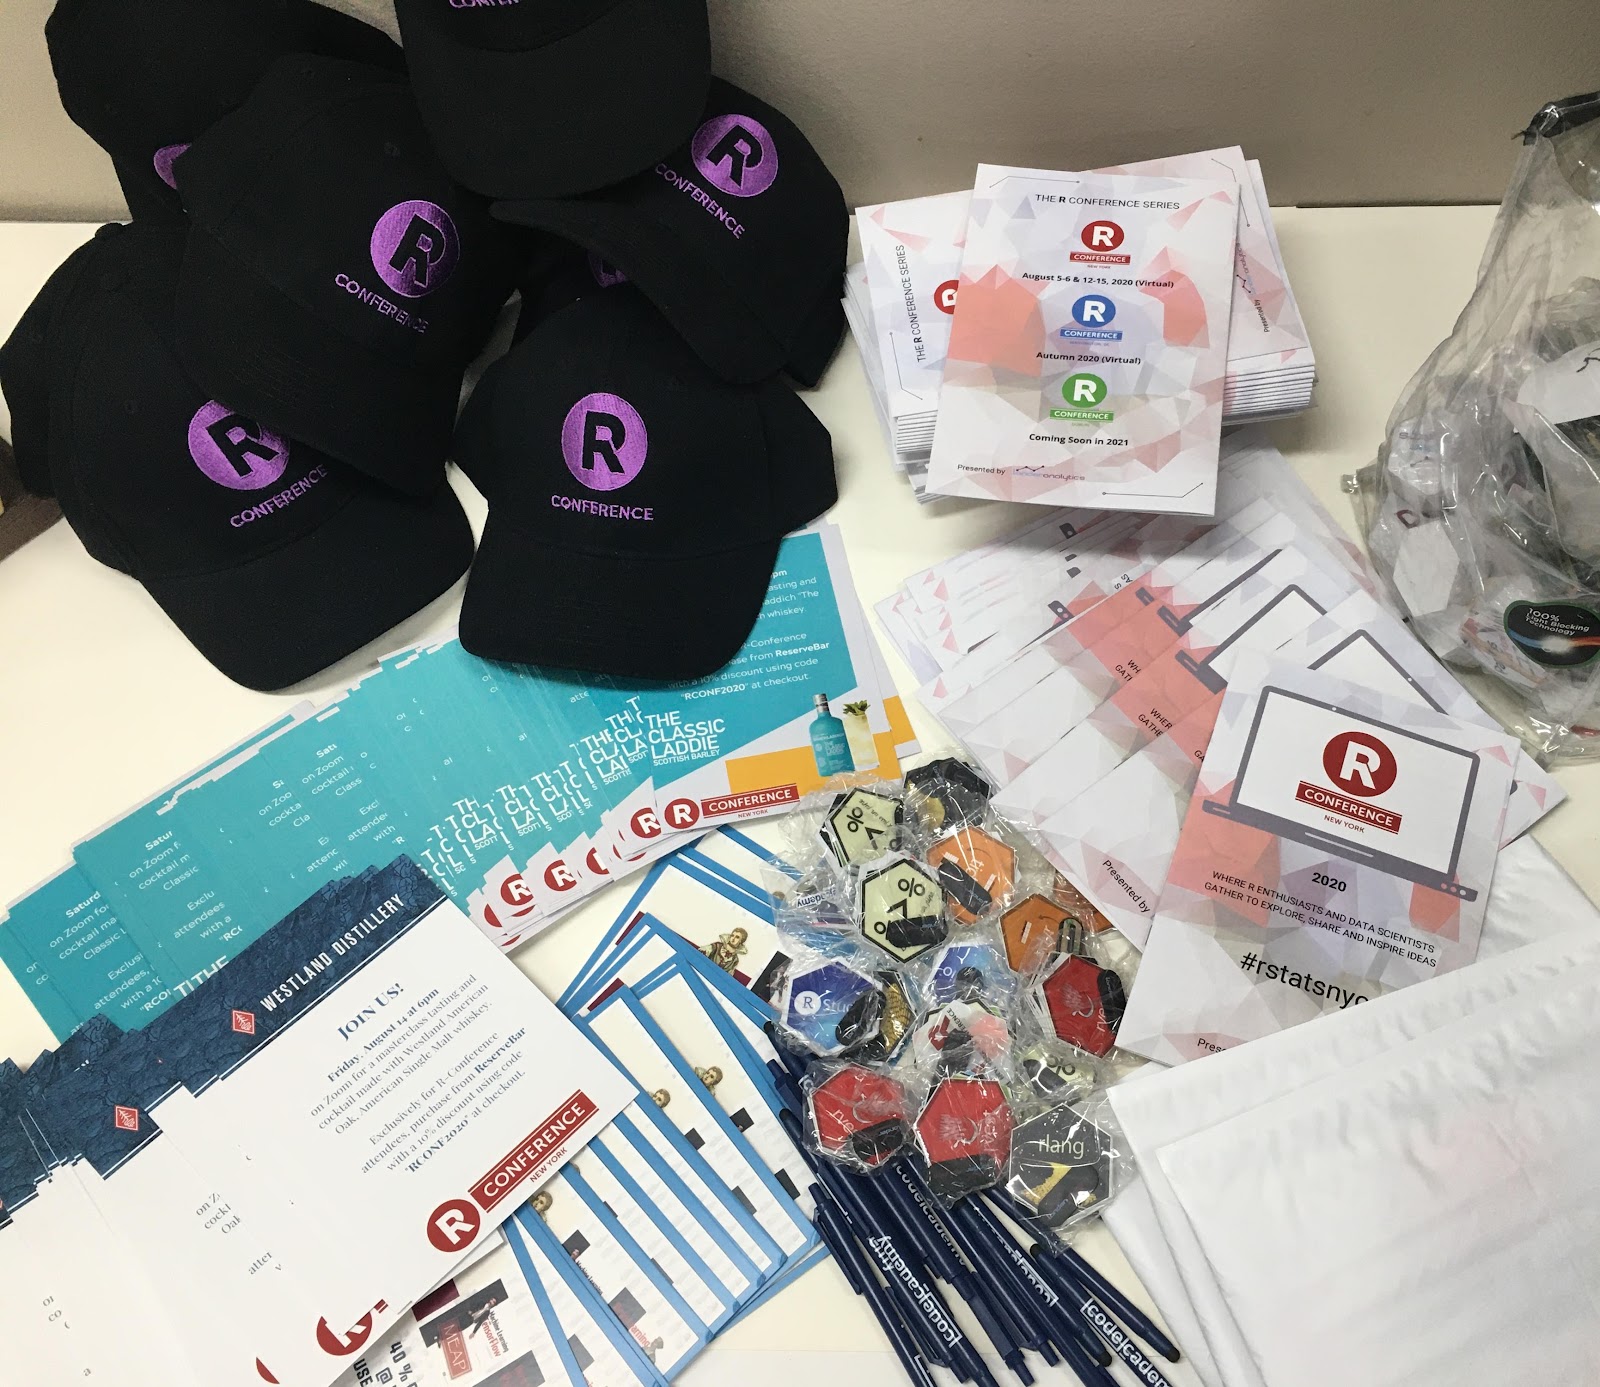
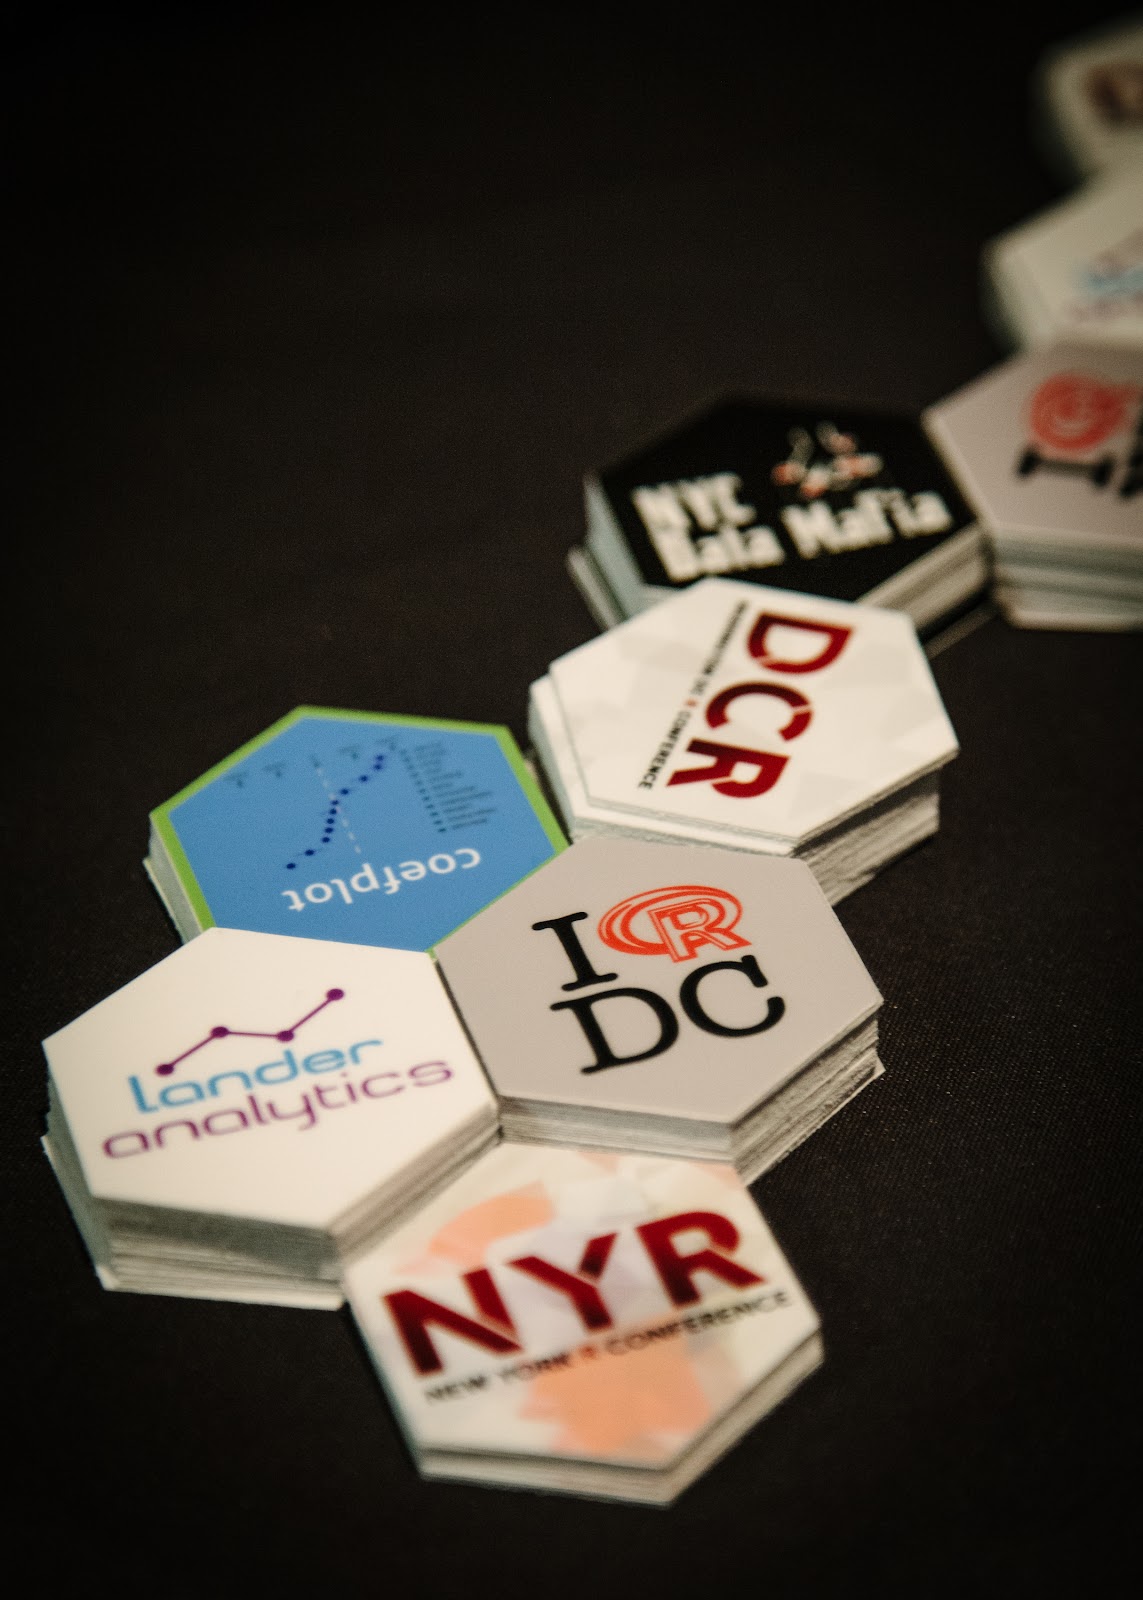
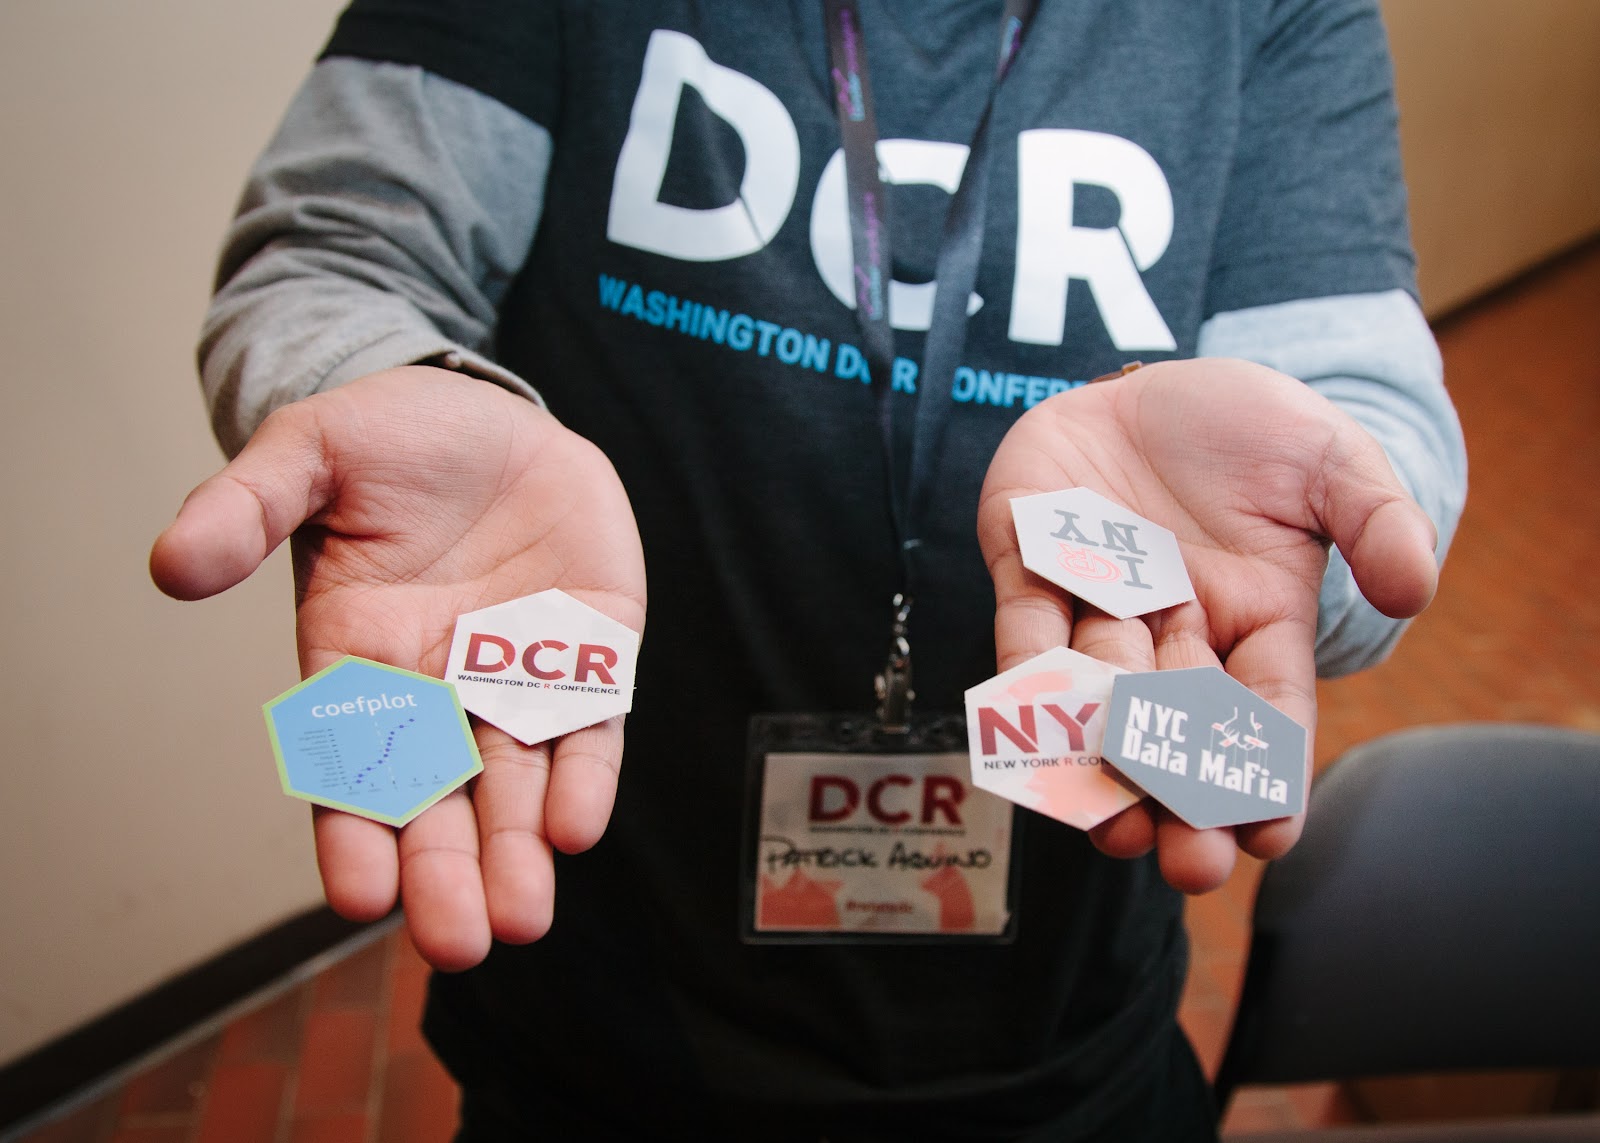
We recreated as much of the in-person experience as possible with attendee networking sessions, the speaker walk-on songs and fun facts, abundant prizes and giveaways, the Twitter contest, an art auction, and happy hours. In addition to all of this, we mailed conference programs, hex stickers, and other swag to each attendee (in the U.S.), along with discount codes from our Vibe Sponsors, MatchaBar, Westland Distillery and Bruichladdich Distillery.
Thank you, Lander Analytics Team!
Even though it was virtual, there was a lot of work that went into the conference, and I want to thank my amazing team at Lander Analytics along with our producer, Bill Prickett, for making it all come together.
Looking Forward to D.C. and Dublin If you attended, we hope you had an incredible experience. If you did not, we hope to see you at the virtual DC R Conference in the fall, and at the first Dublin R Conference and the NYR next year!
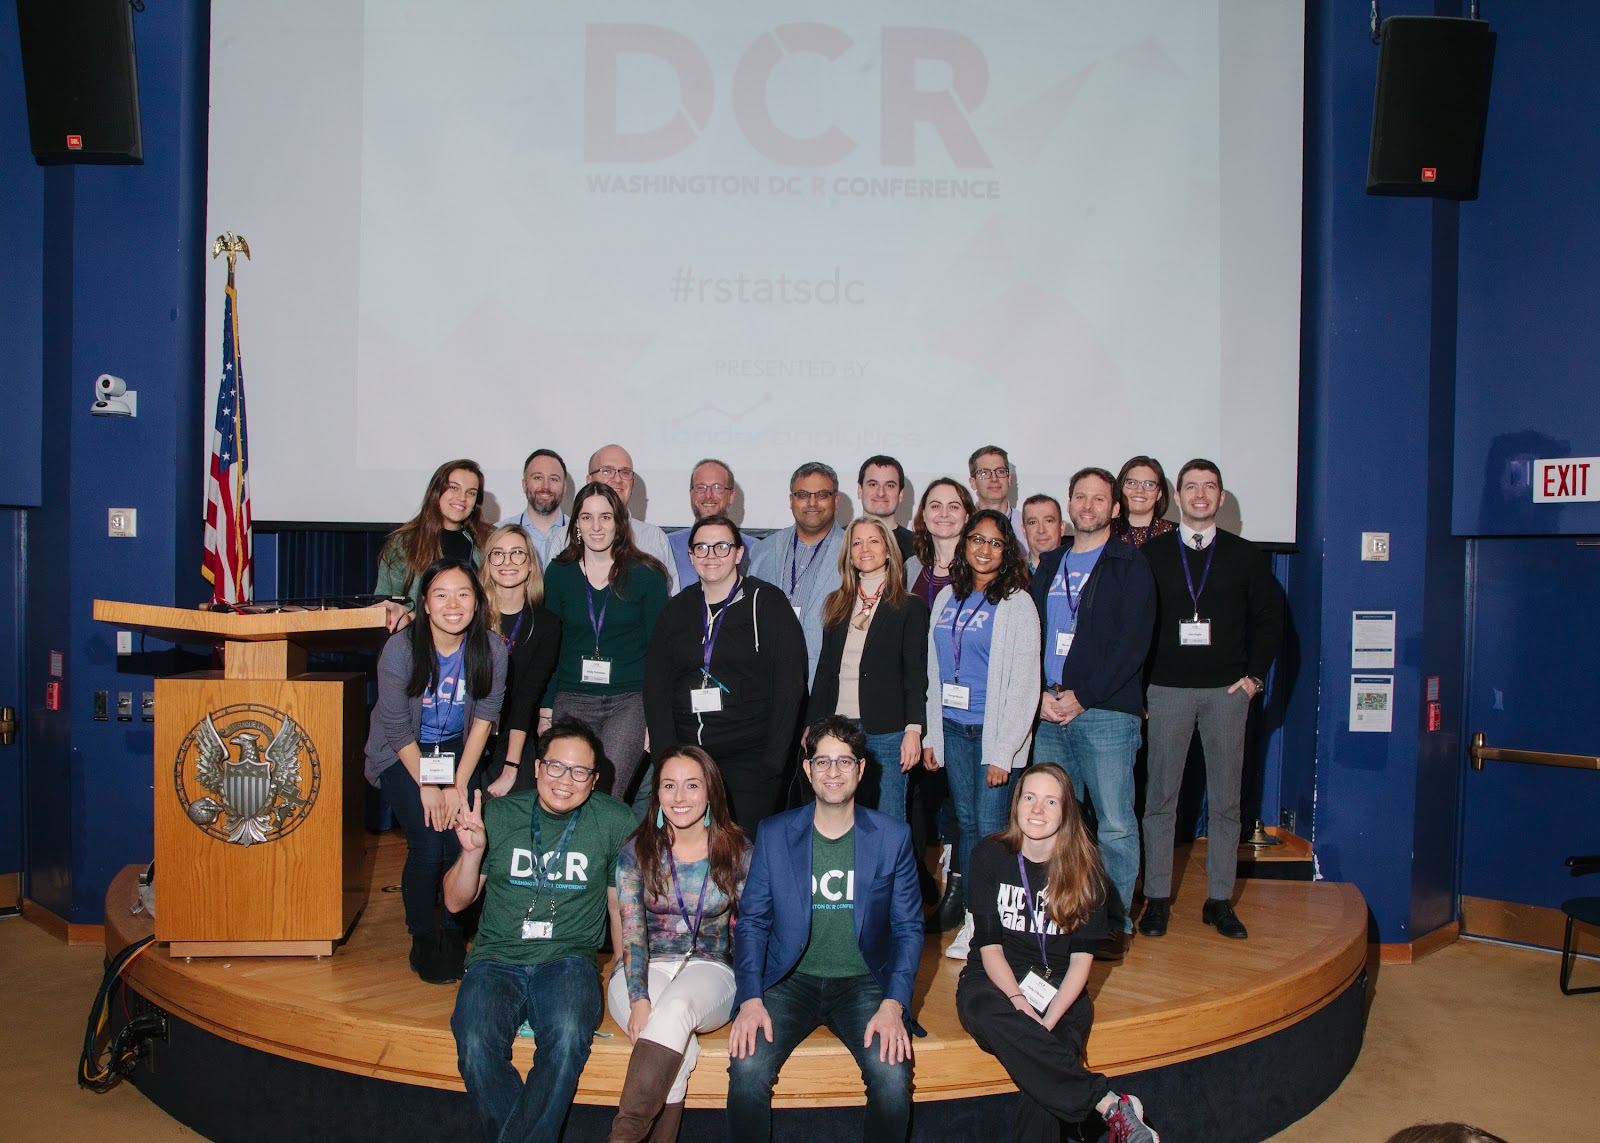
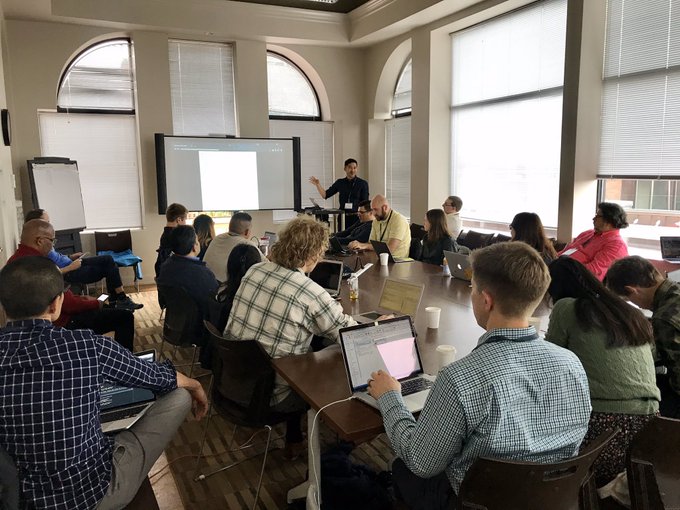
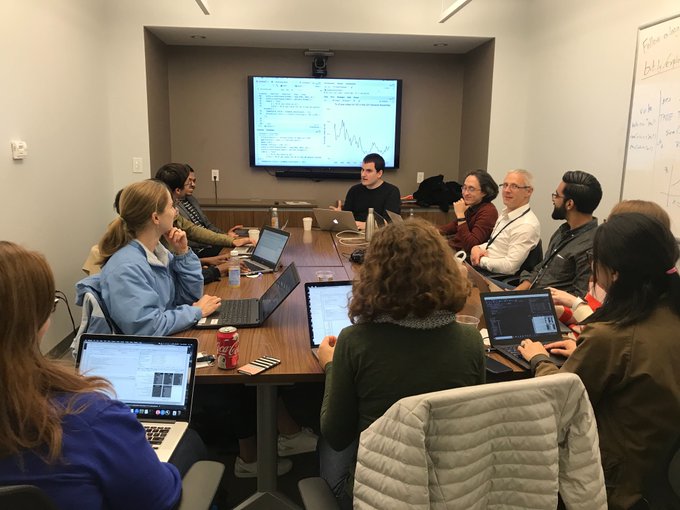
The Second Annual DCR Conference made its way to the ICC Auditorium at Georgetown University last week on November 8th and 9th. A sold-out crowd of R enthusiasts and data scientists gathered to explore, share and inspire ideas.
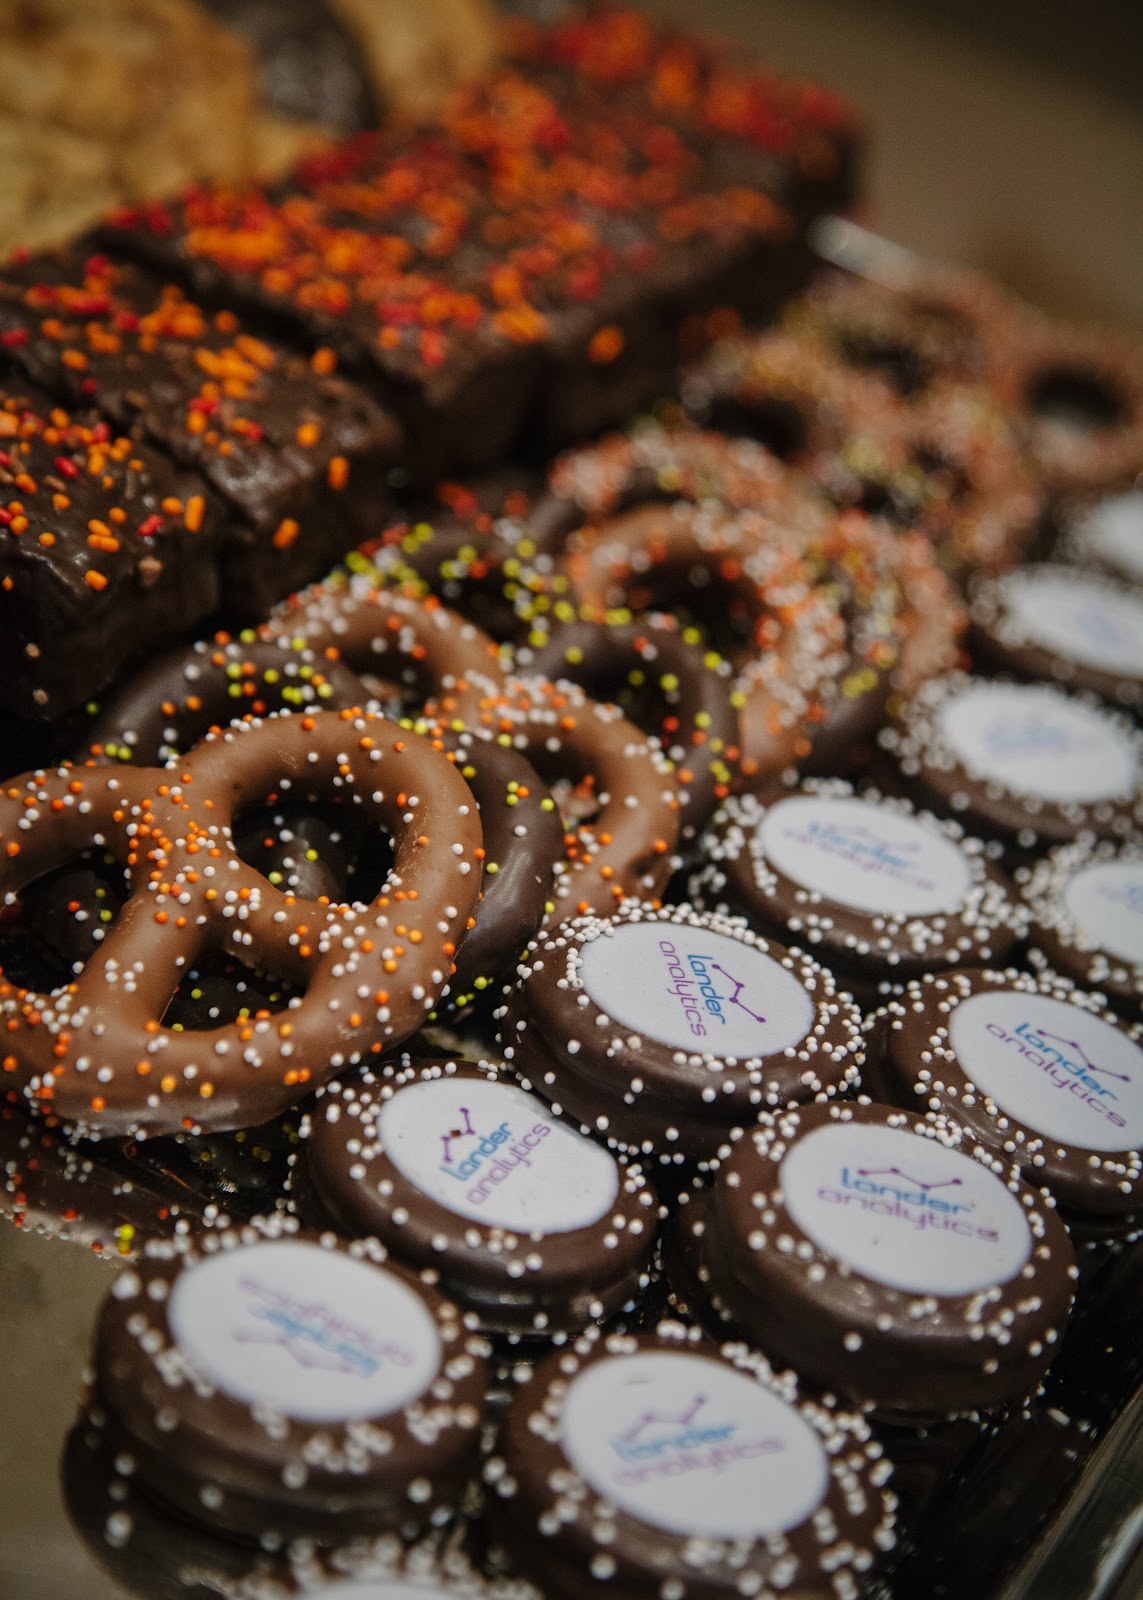
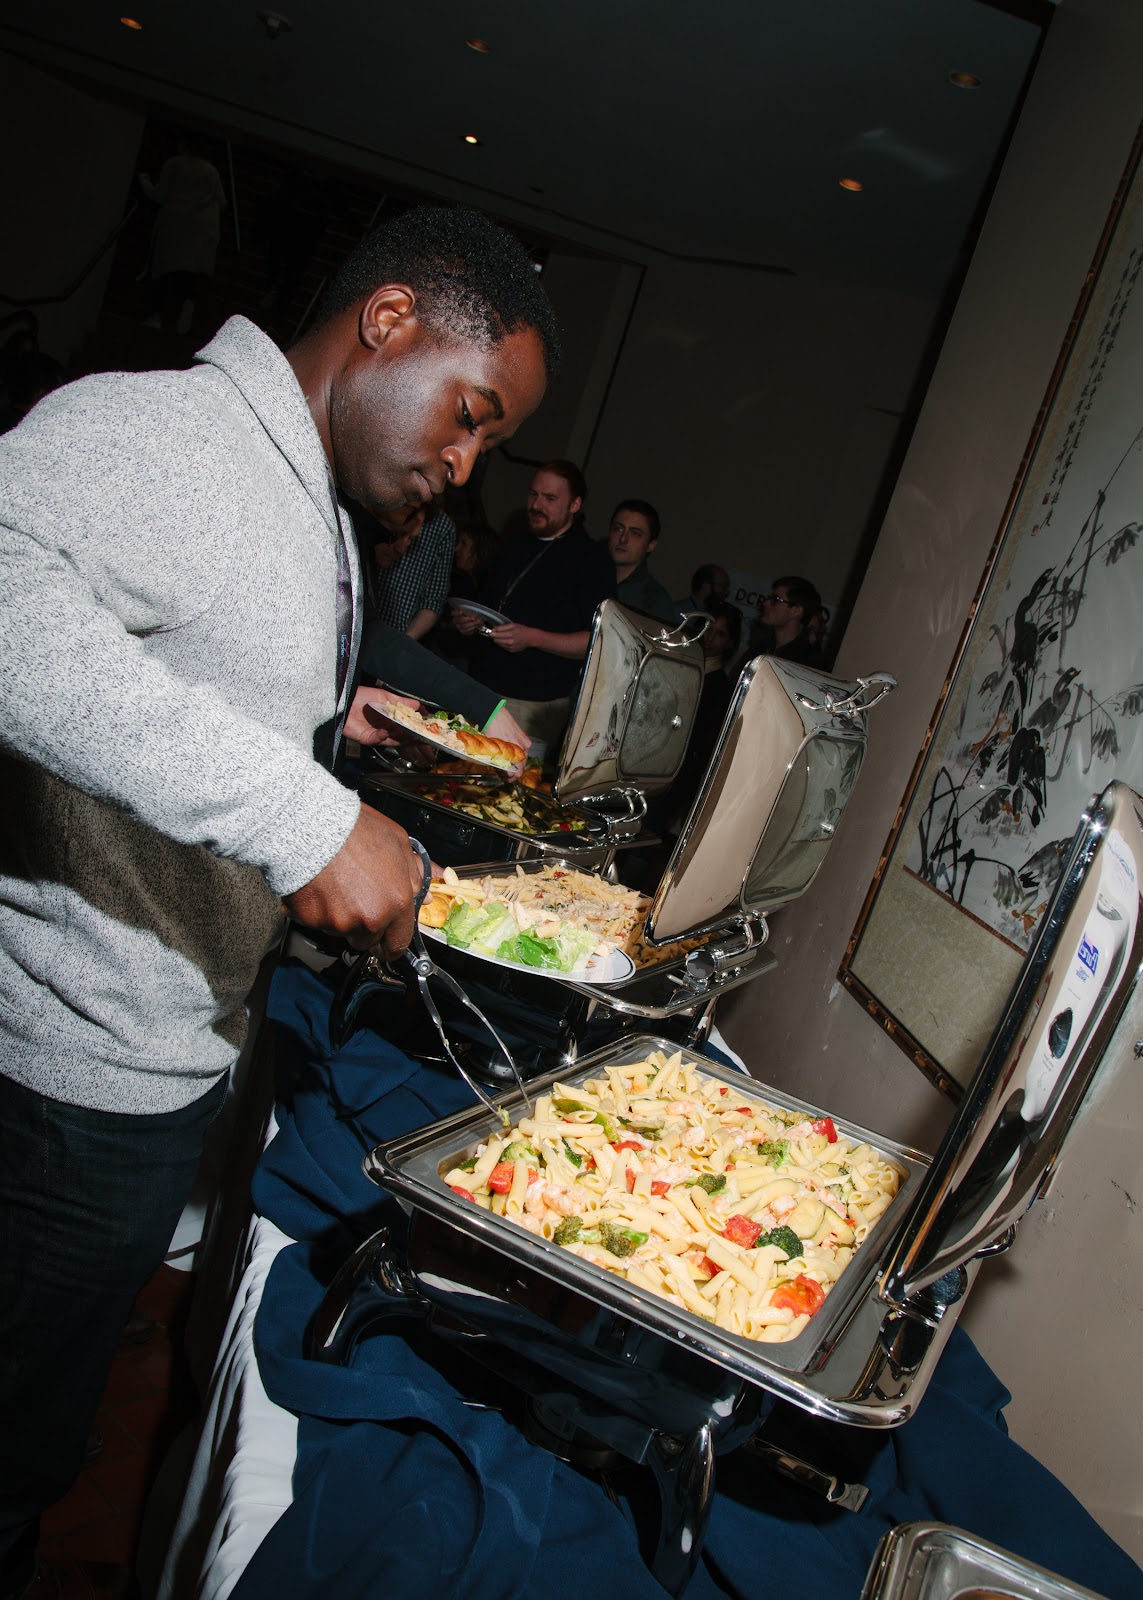
As always, the food was delicious! Our caterer even surprised us with Lander cookies.
Lander Analytics CookiesThe Excellent Buffet
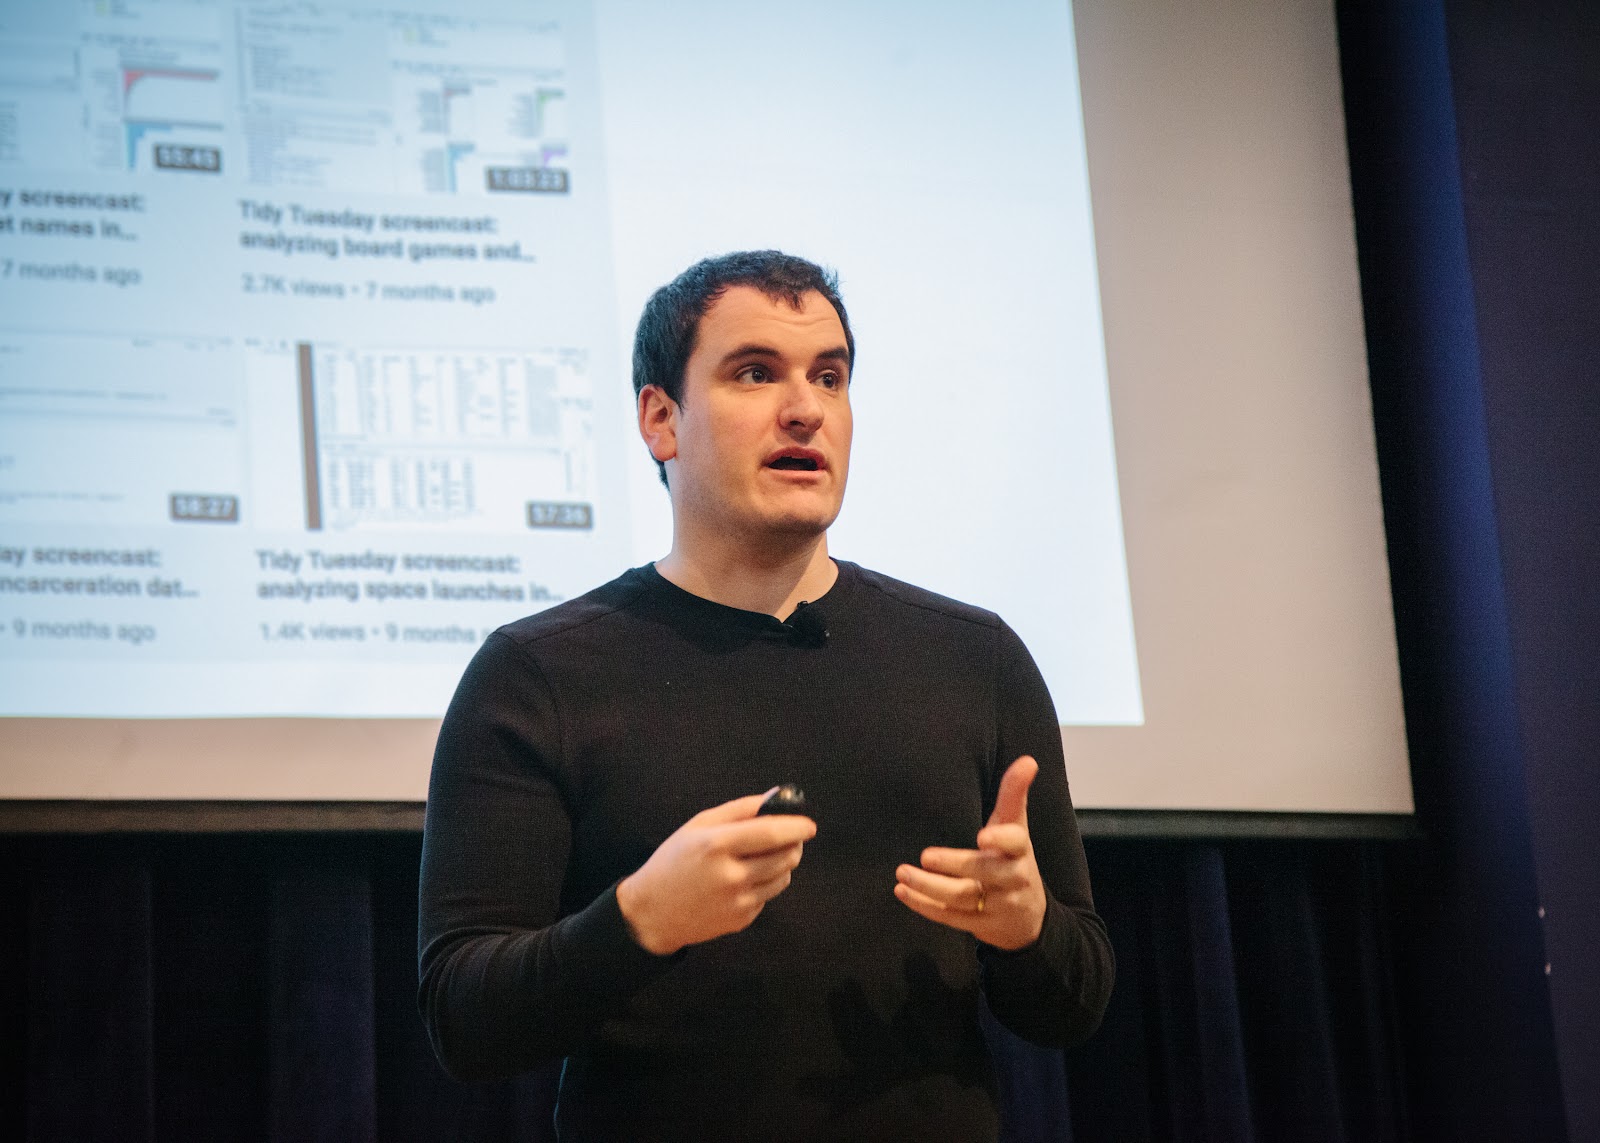
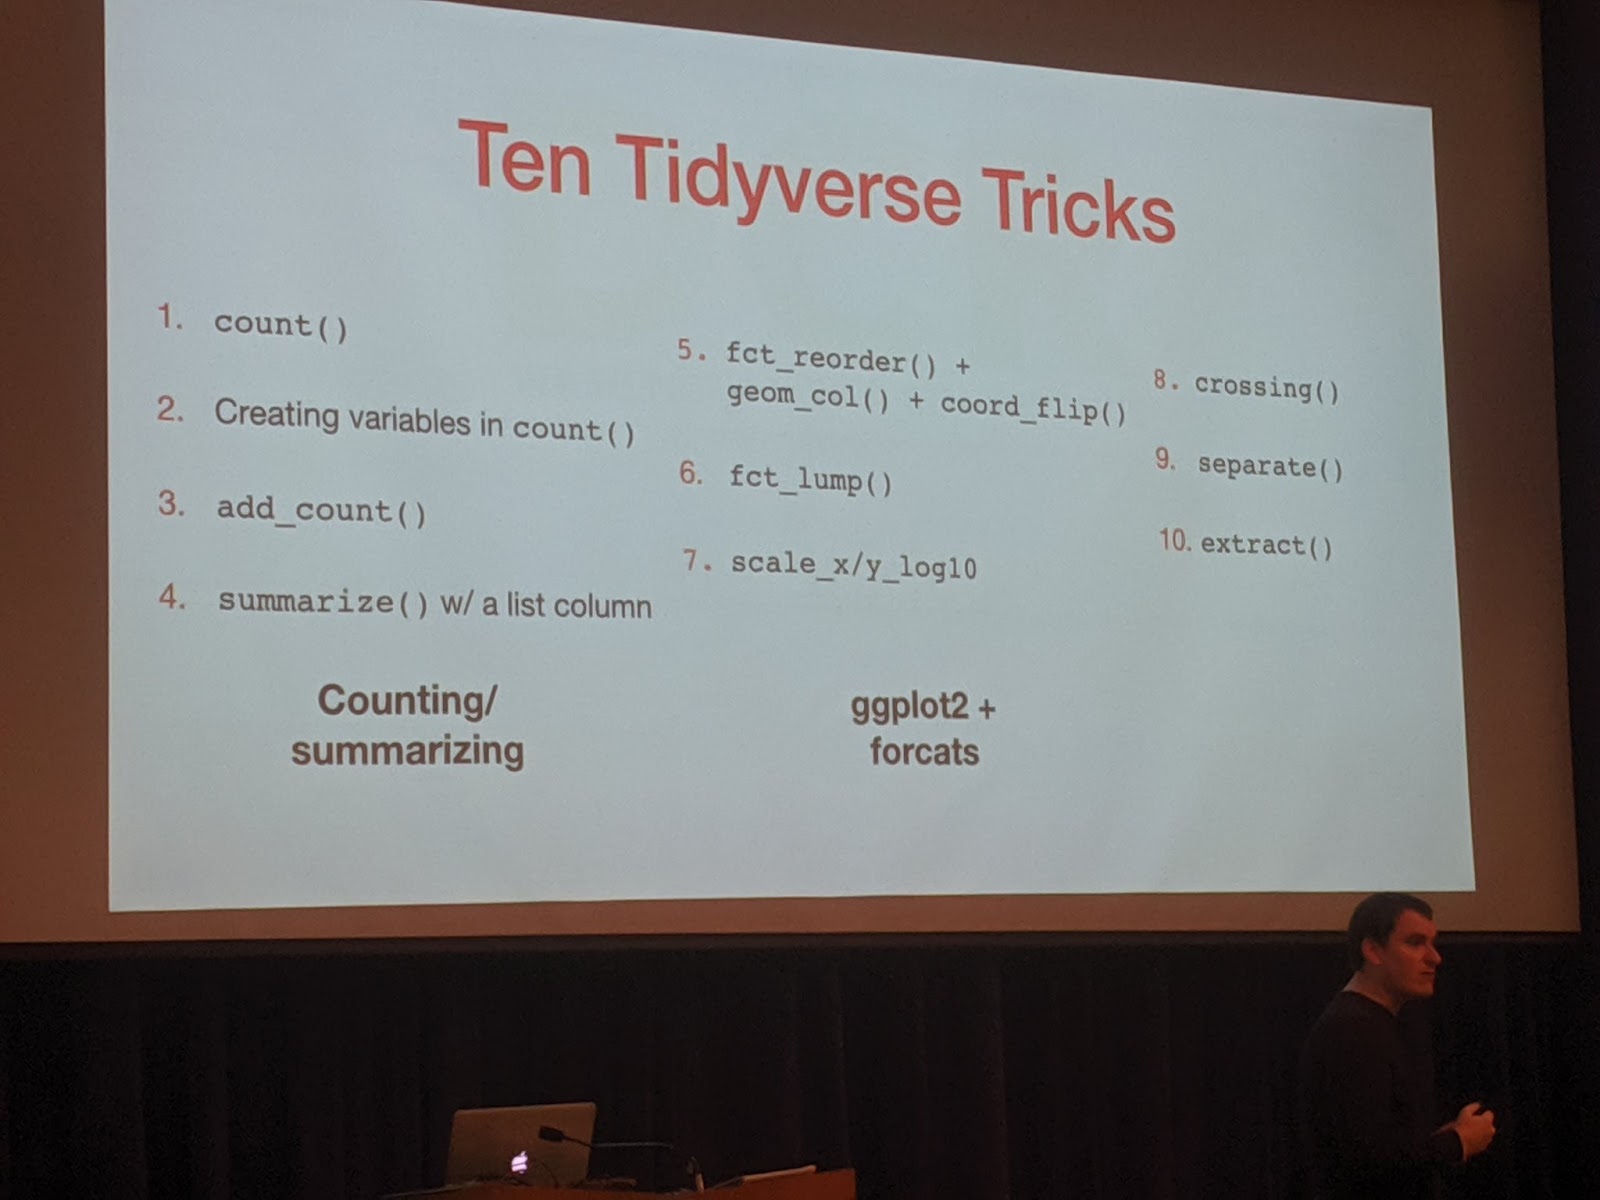
David Robinson shared his Ten Tremendous Tricks in the Tidyverse. Always enthusiastic, DRob did a great job showing both well known and obscure functions for an easier data workflow.
DRobTen Tidyverse Tricks
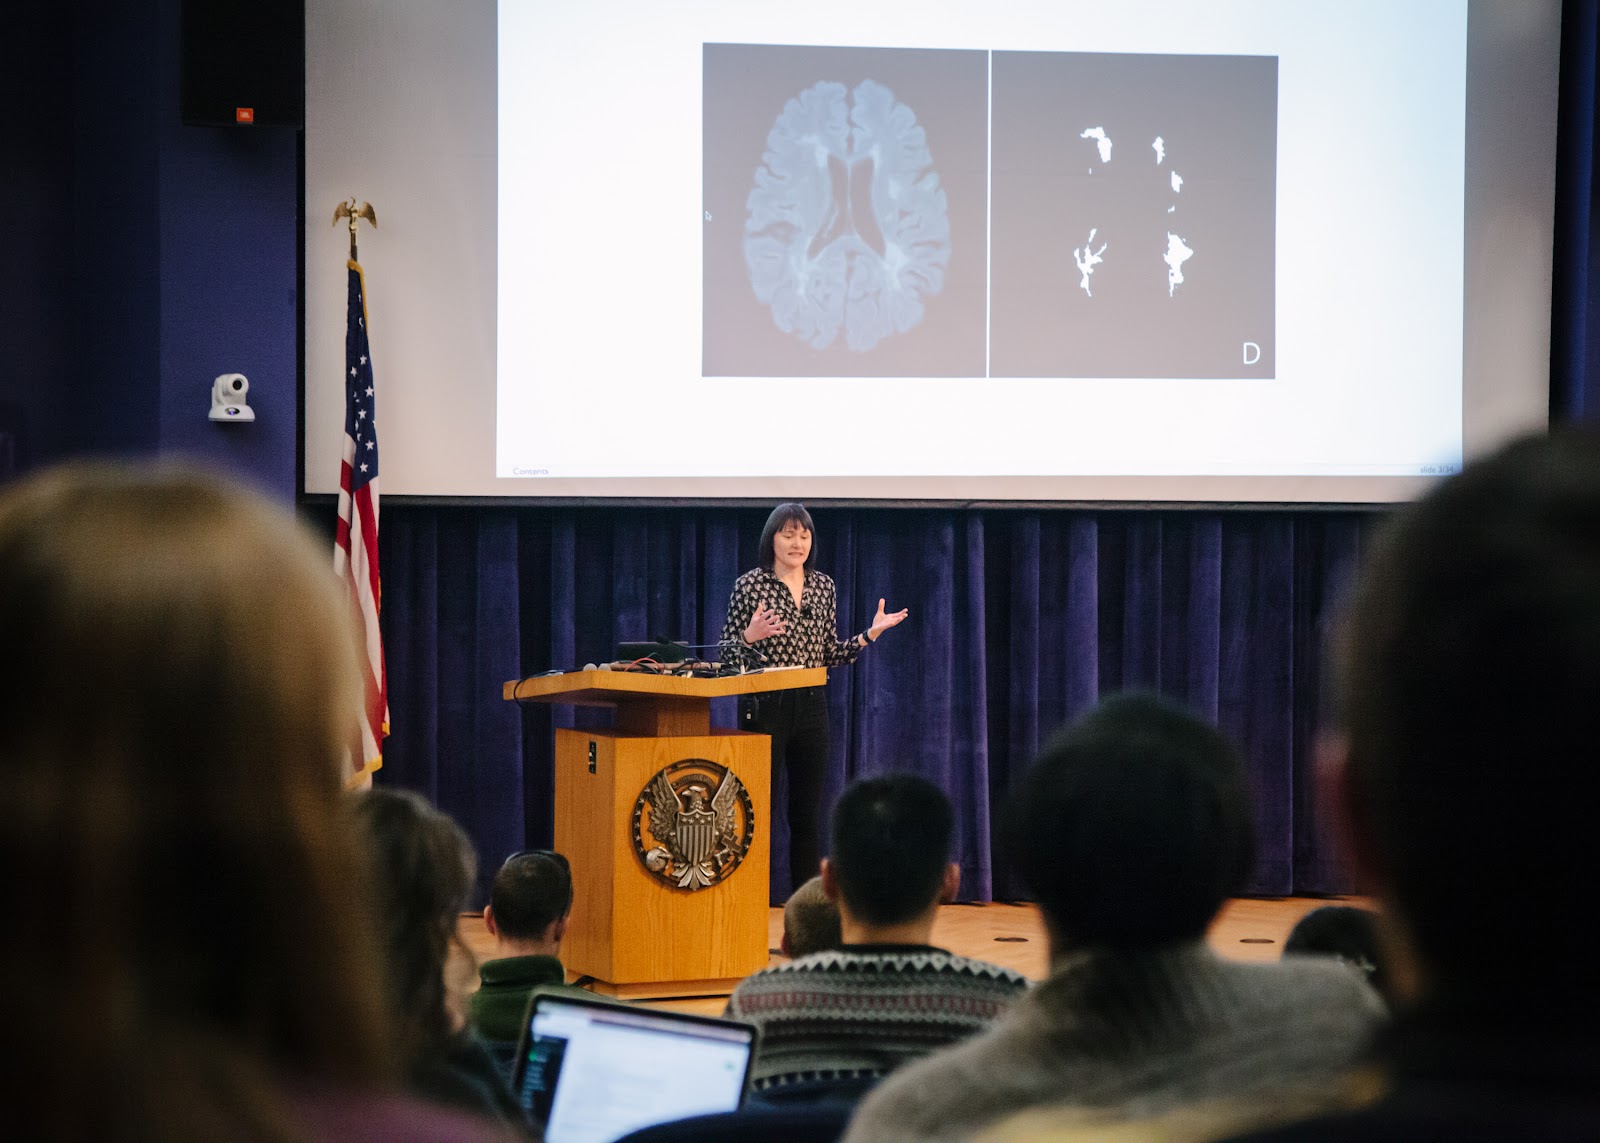
Elizabeth Sweeney gave an awesome talk on Visualizing the Environmental Impact of Beef Consumption using Plotly and Shiny. We explored the impact of eating different cuts of beef in terms of the number of animal lives, Co2 emissions, water usage, and land usage. Did you know that there is a big difference in the environmental impact of consuming 100 pounds of hanger steak versus the same weight in ground beef? She used plotly to make interactive graphics and R Shiny to make an interactive webpage to explore the data.
Elizabeth Showing off Brains
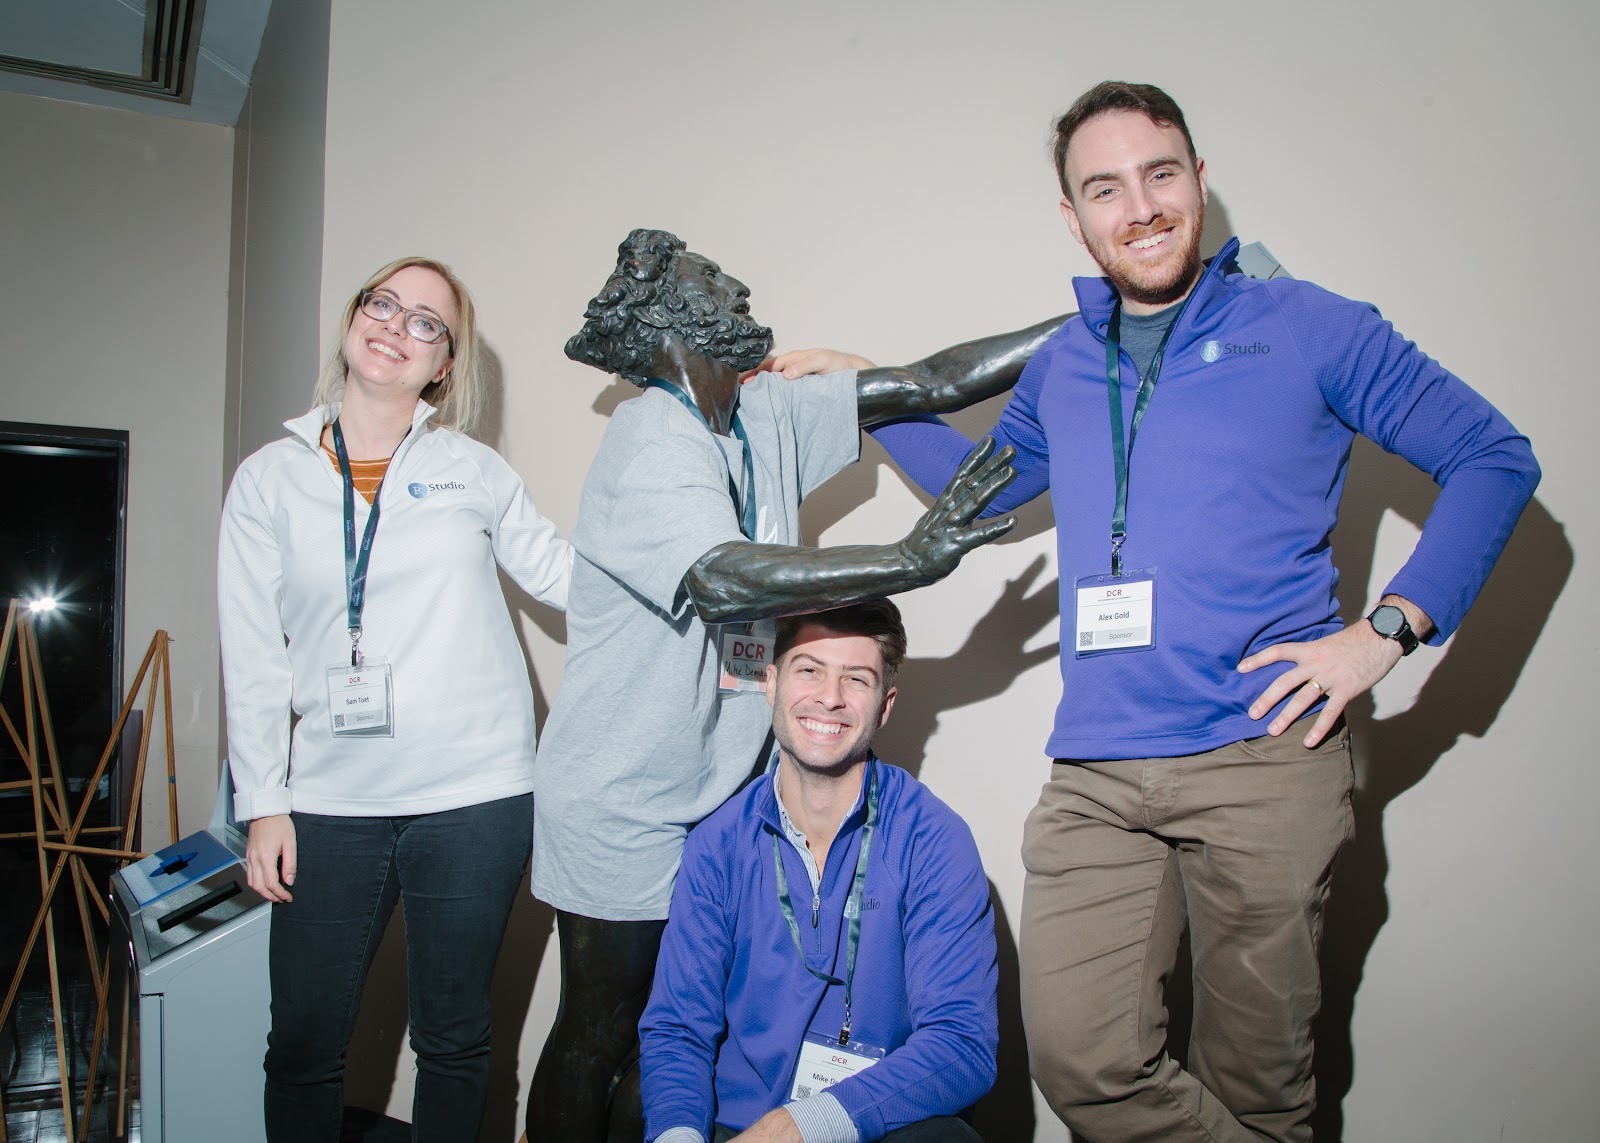
The integrated development environment, RStudio, fully integrated themselves into the environment.
The RStudio Team
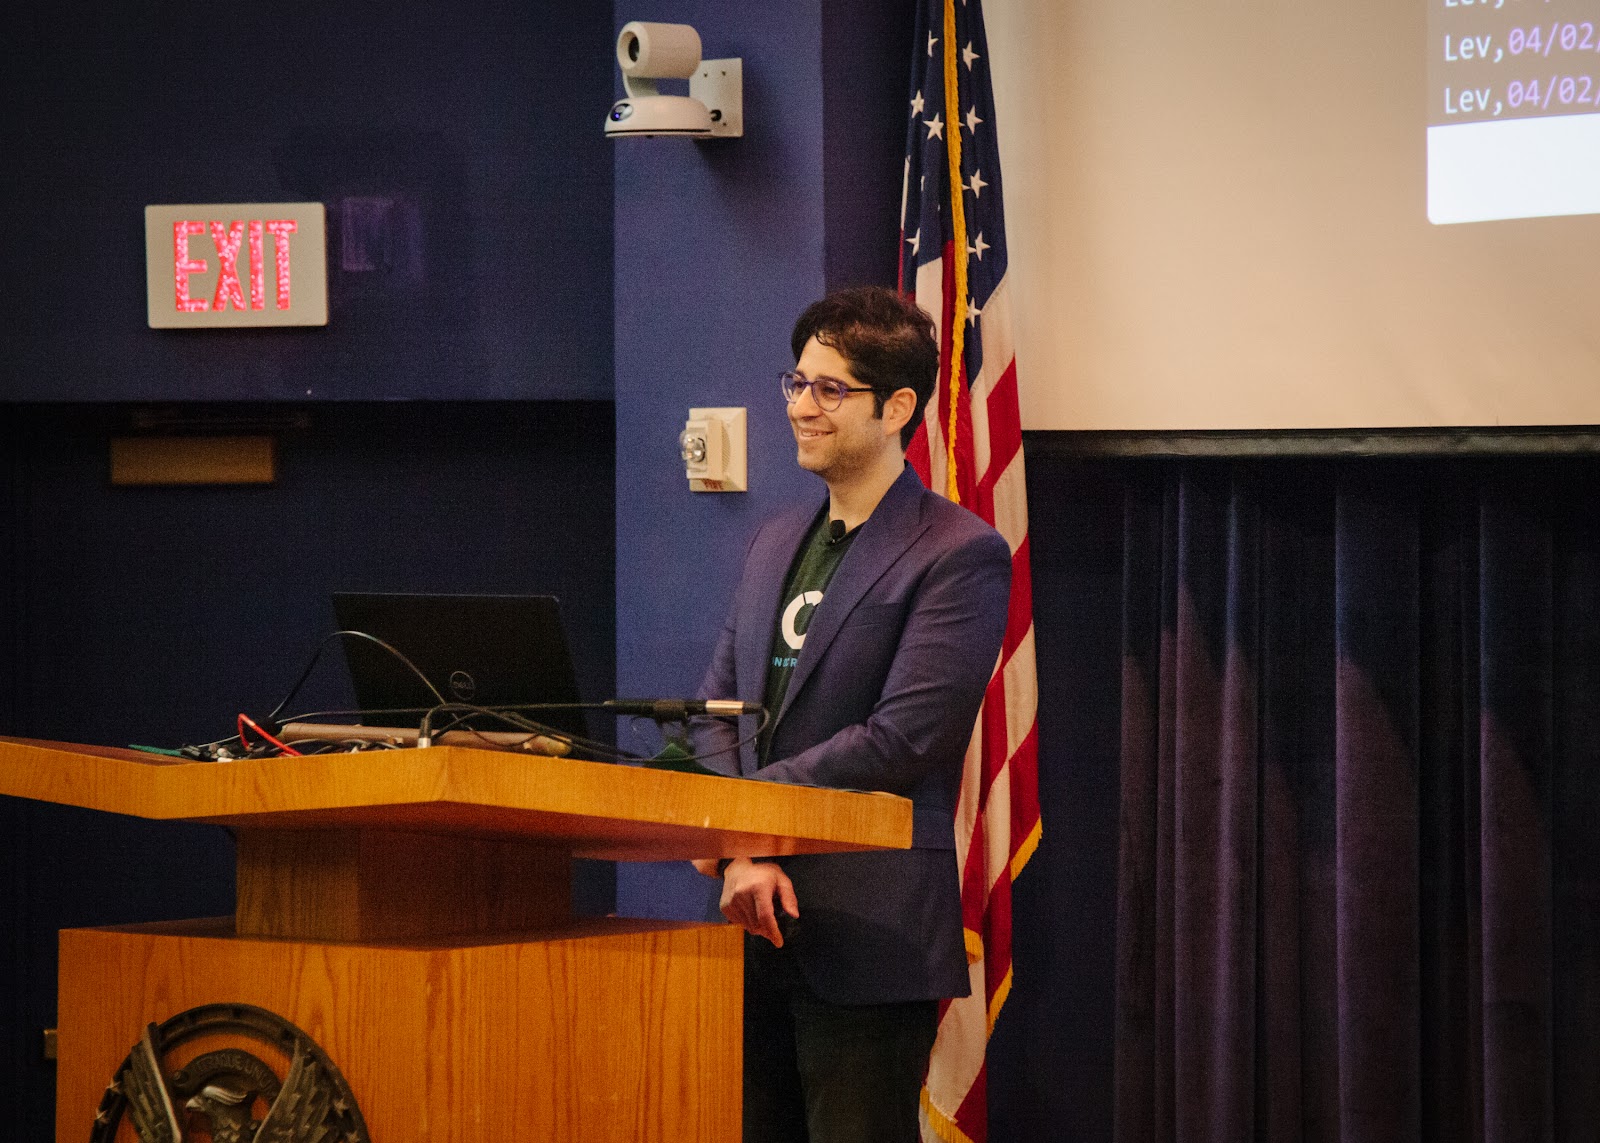
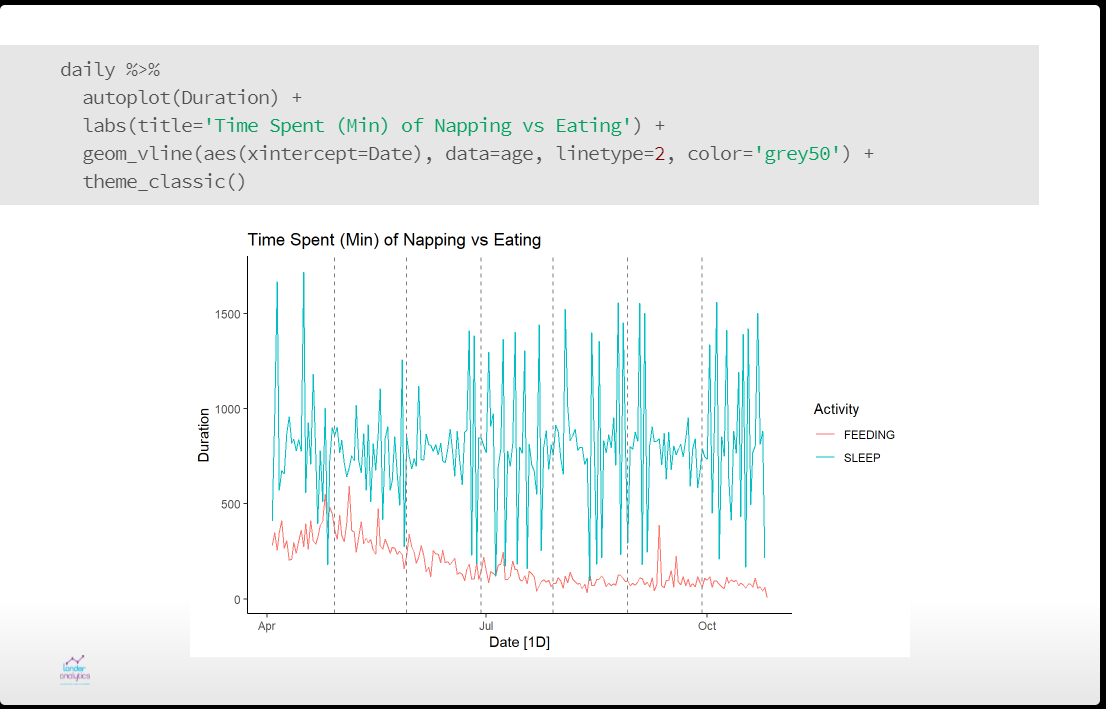
As a father, I’ve earned the right to make dad jokes (see above). You can see the slides for my talk, Raising Baby with R. While babies are commonly called bundles of joy, they are also bundles of data. Being the child of a data scientist and neuroscientist my son was certain to be analyzed myriad ways. I discussed how we used data to narrow down possible names then looked at using time series methods to analyze his sleeping and eating patterns. All in the name of science.
Talking Baby Data
Malorie Hughes Analyzing Tweets Again
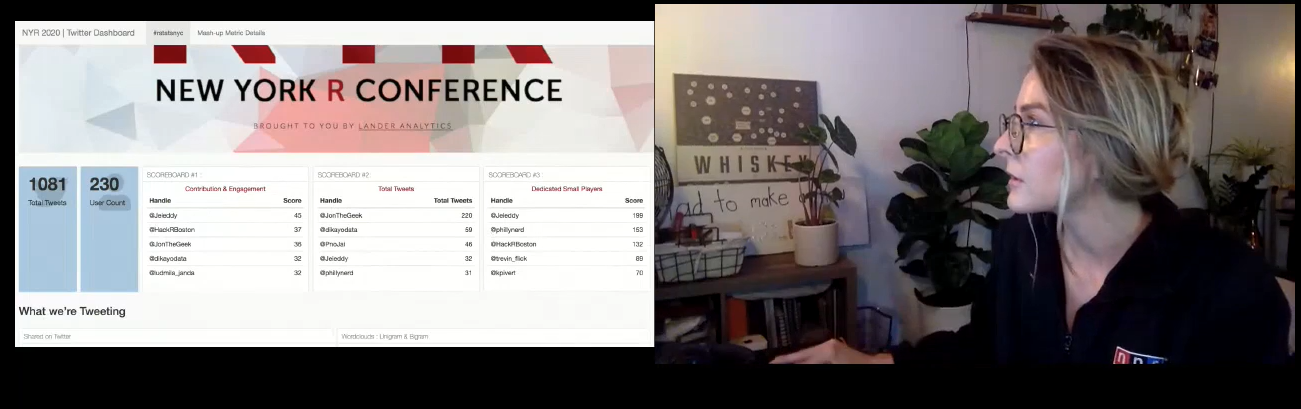
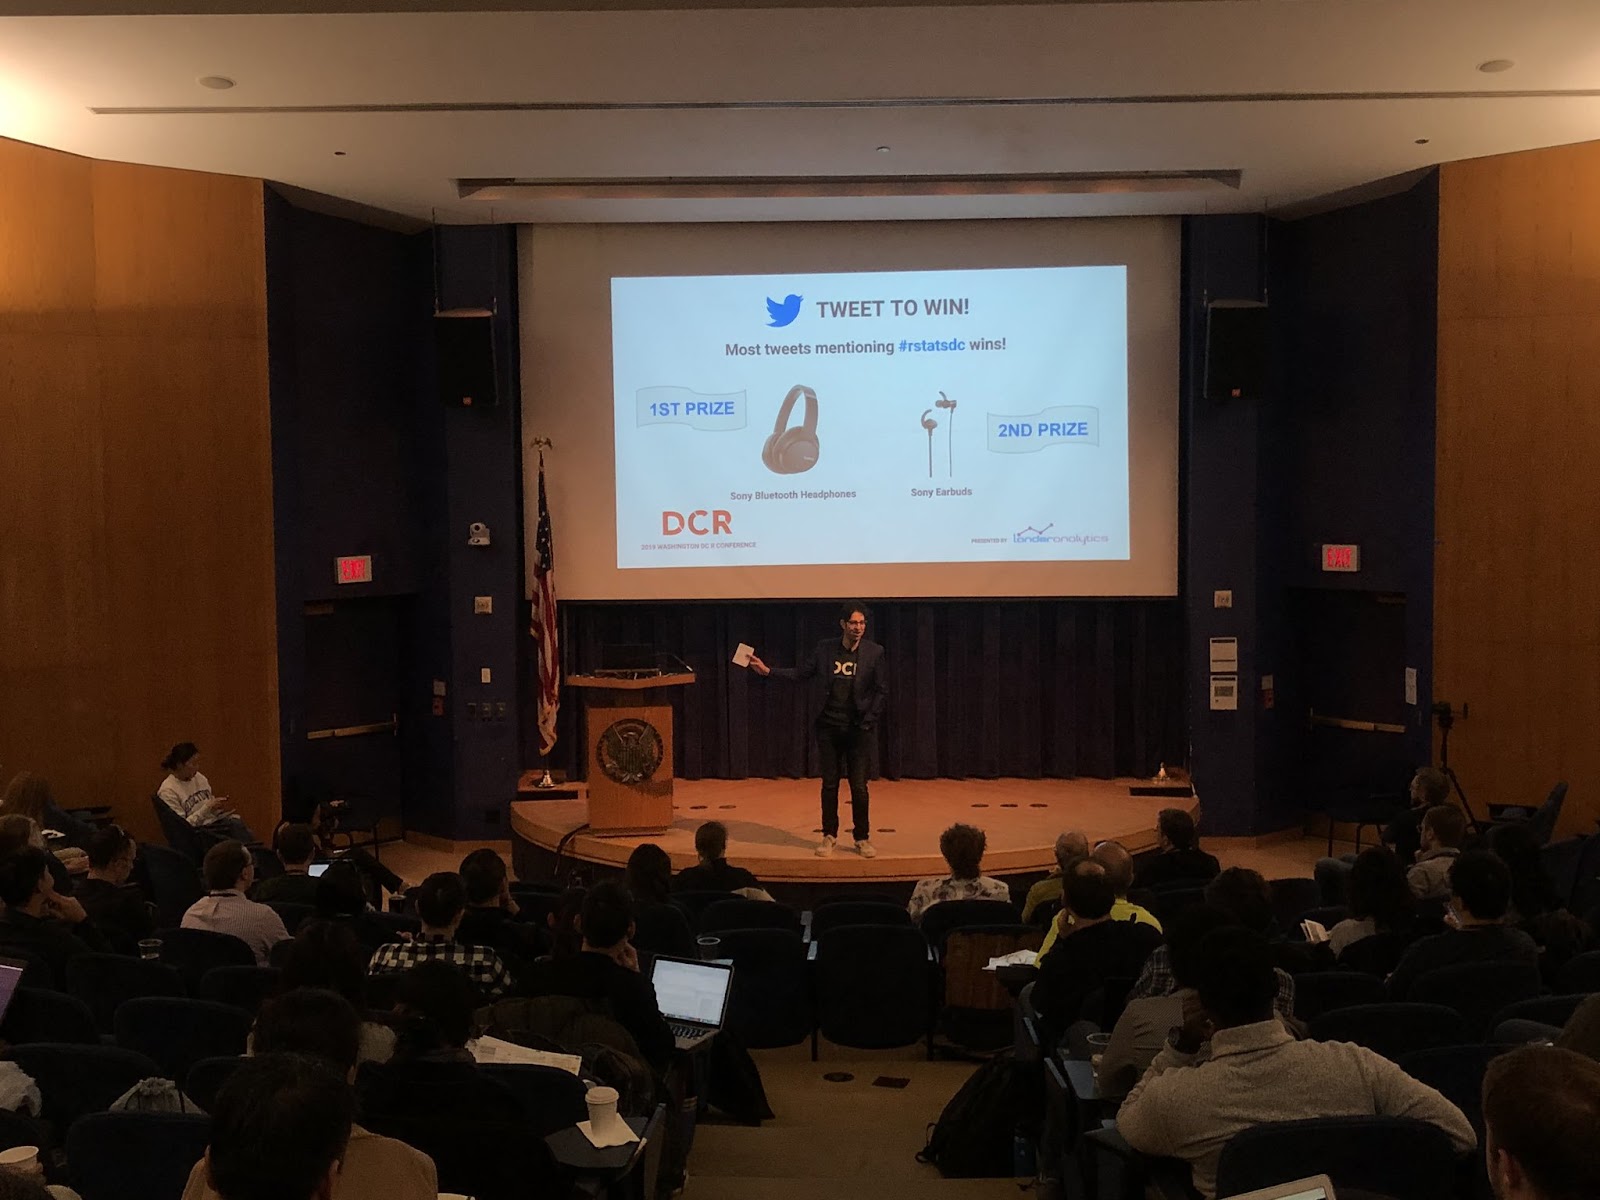
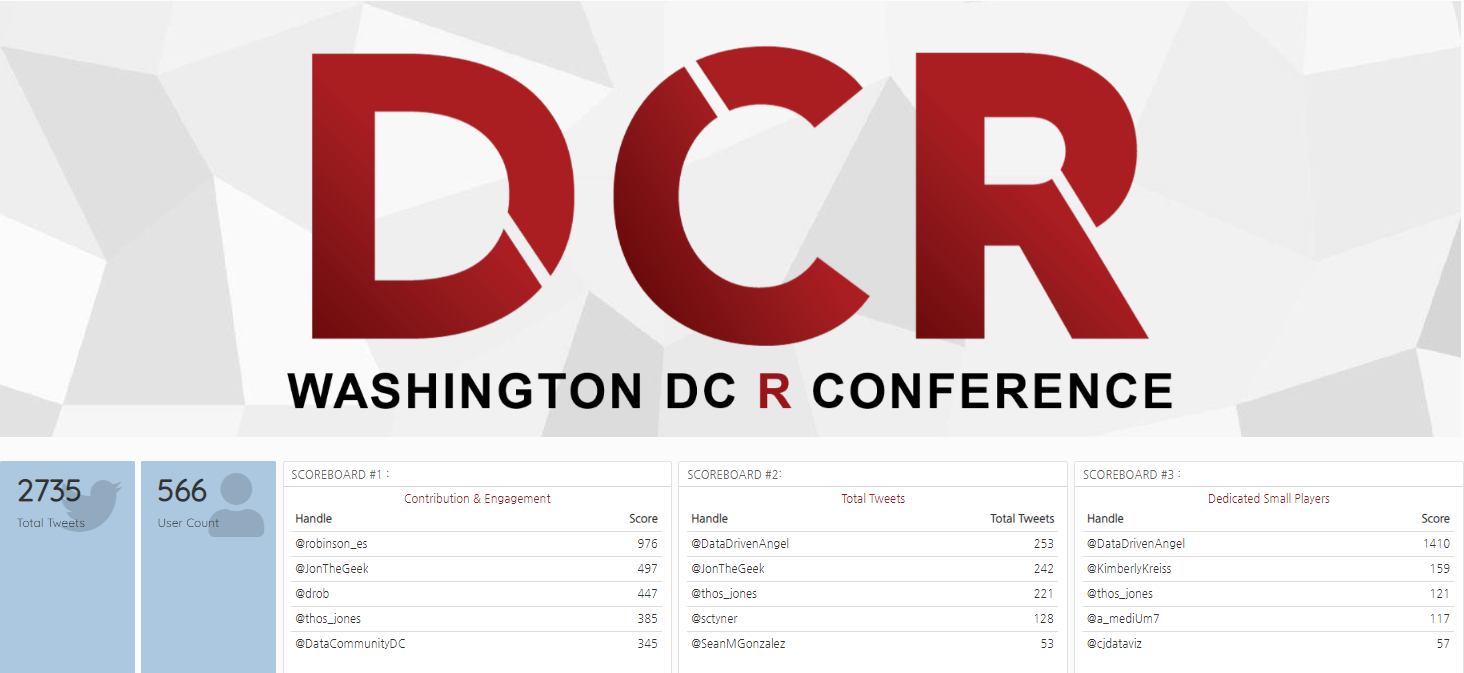
We also organized a Tweeting competition with the help of Malorie Hughes, our Twitter scorekeeper. Check out the DCR 2019 Twitter Dashboard with the Mash-Up Metric Details she created.
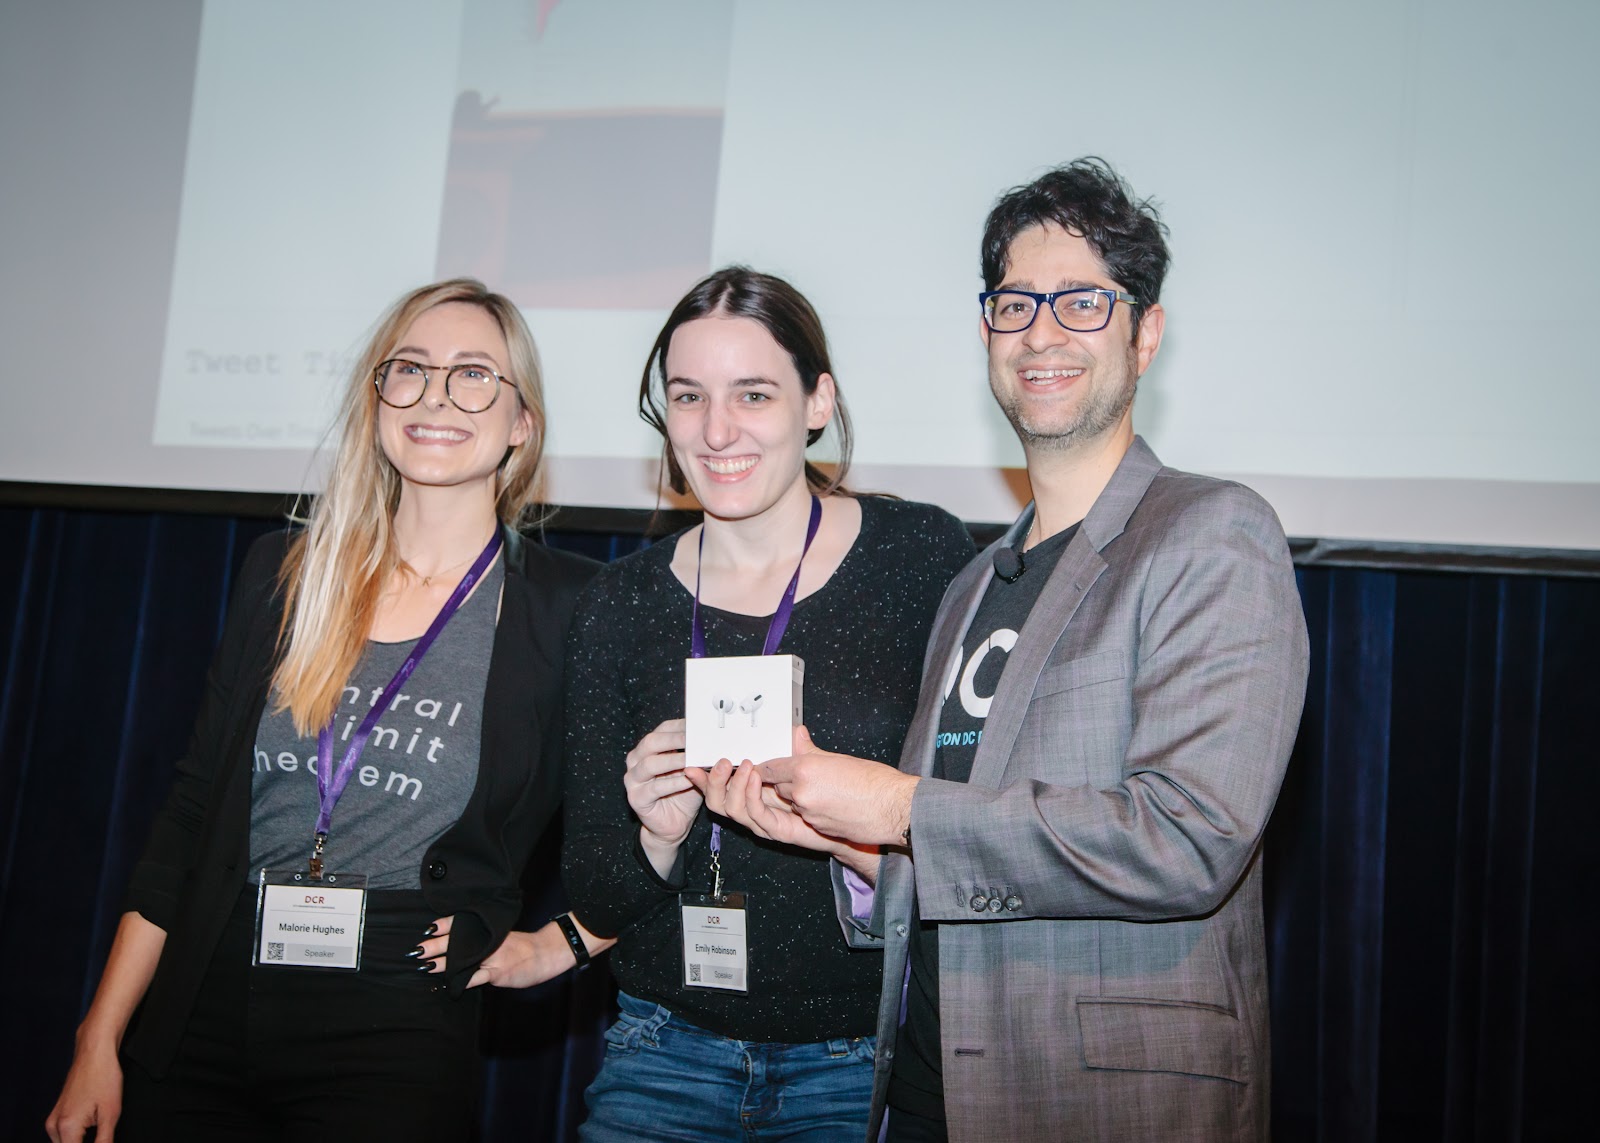
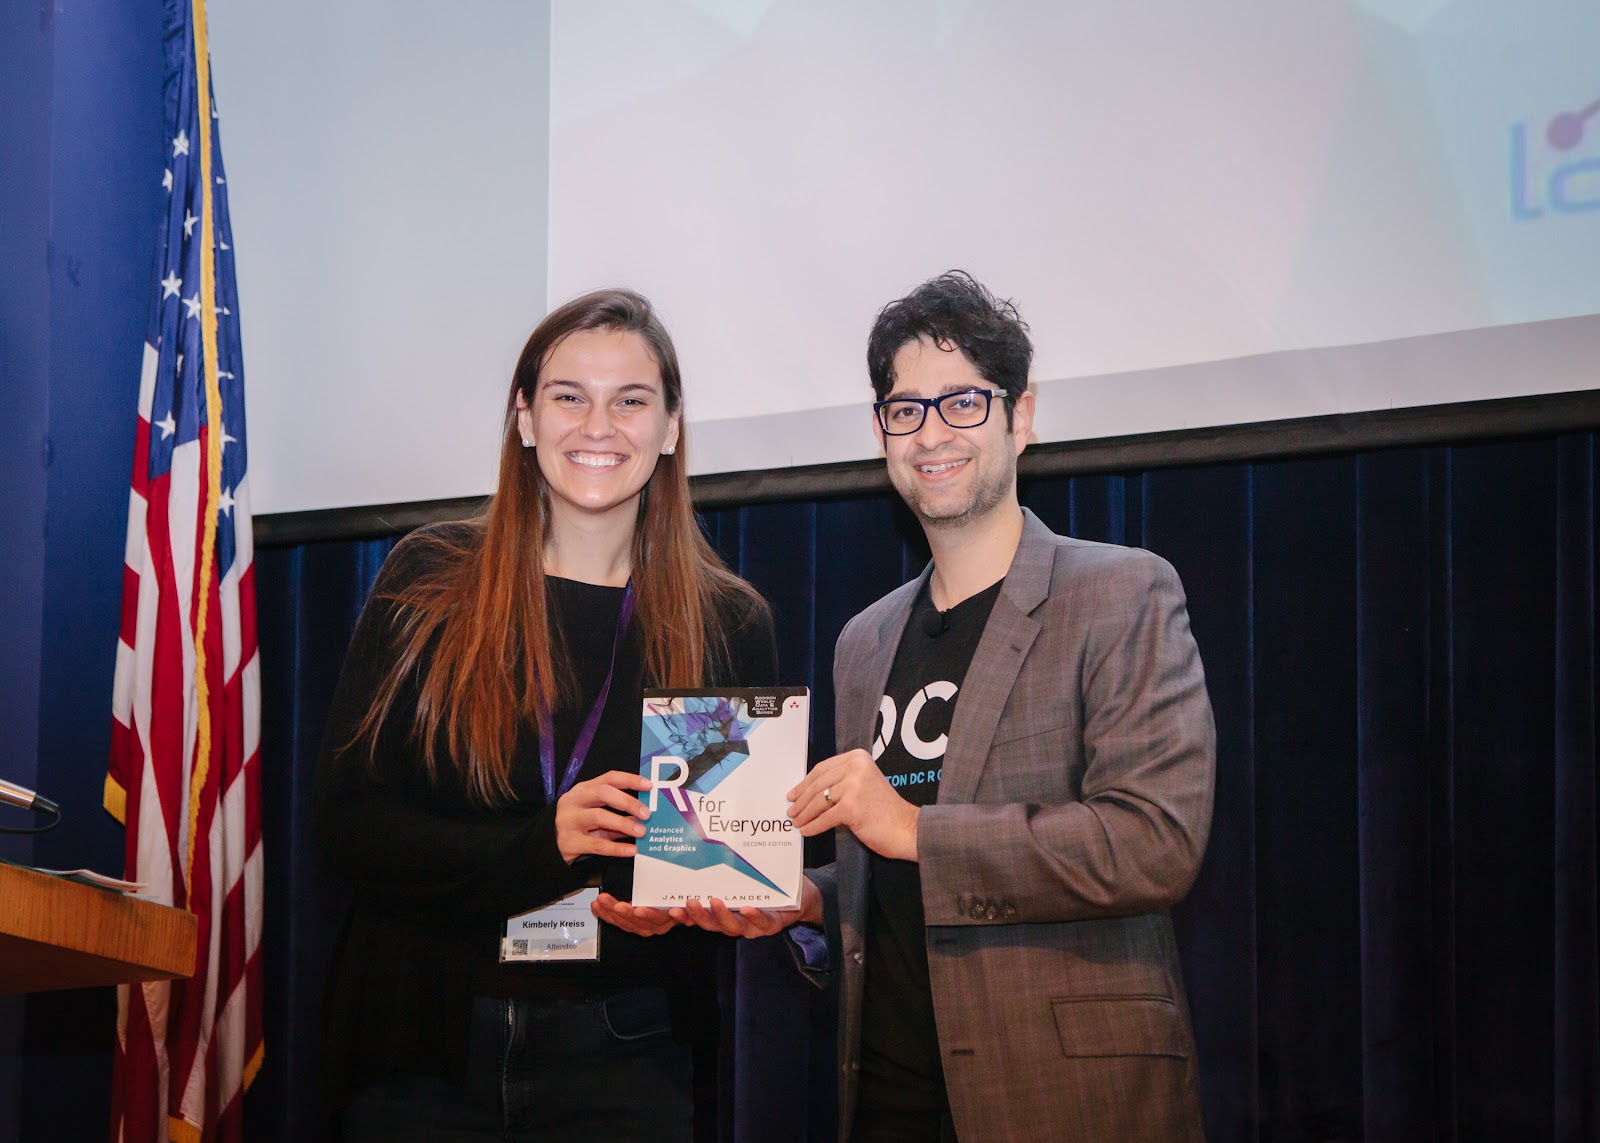
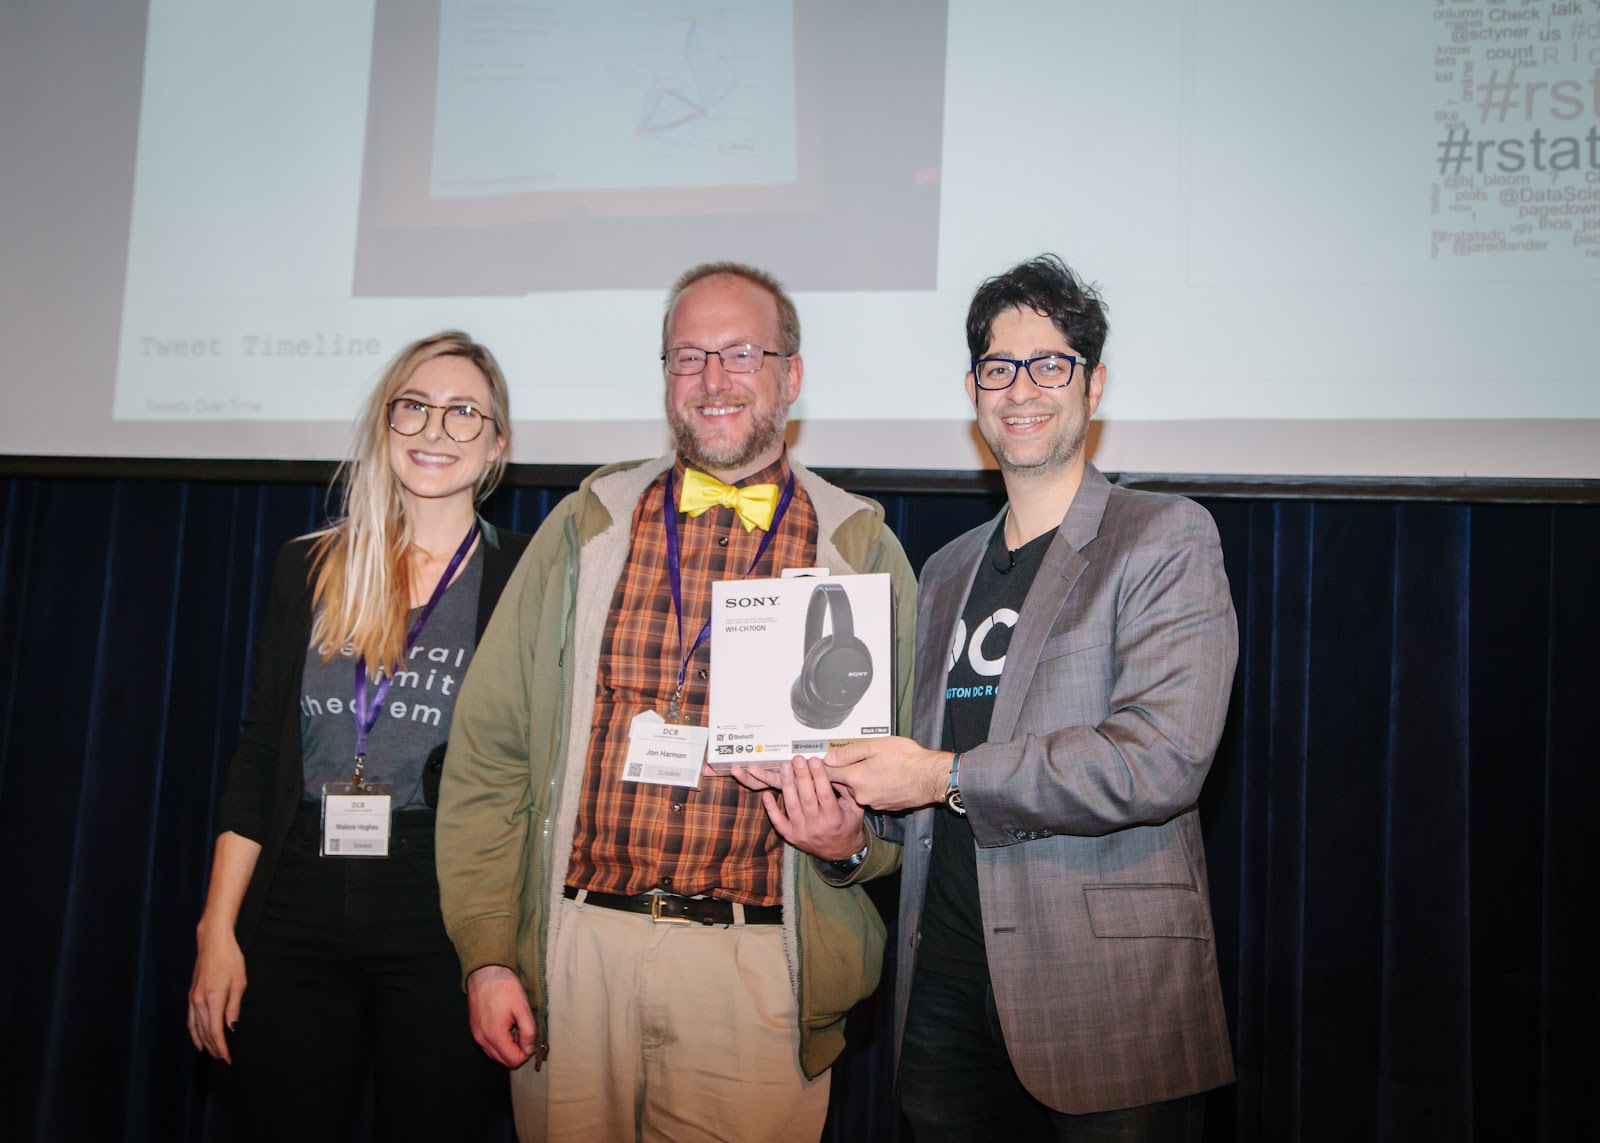
Tweeting DashboardAs Usual, Emily was the Overall WinnerKim Won a Copy of my BookJon Really Worked Hard to Win These Headphones
There was a glitch in the system and one of our own organizers and former Python user won a prize. We let her keep it, and now she has no excuse not to learn R.
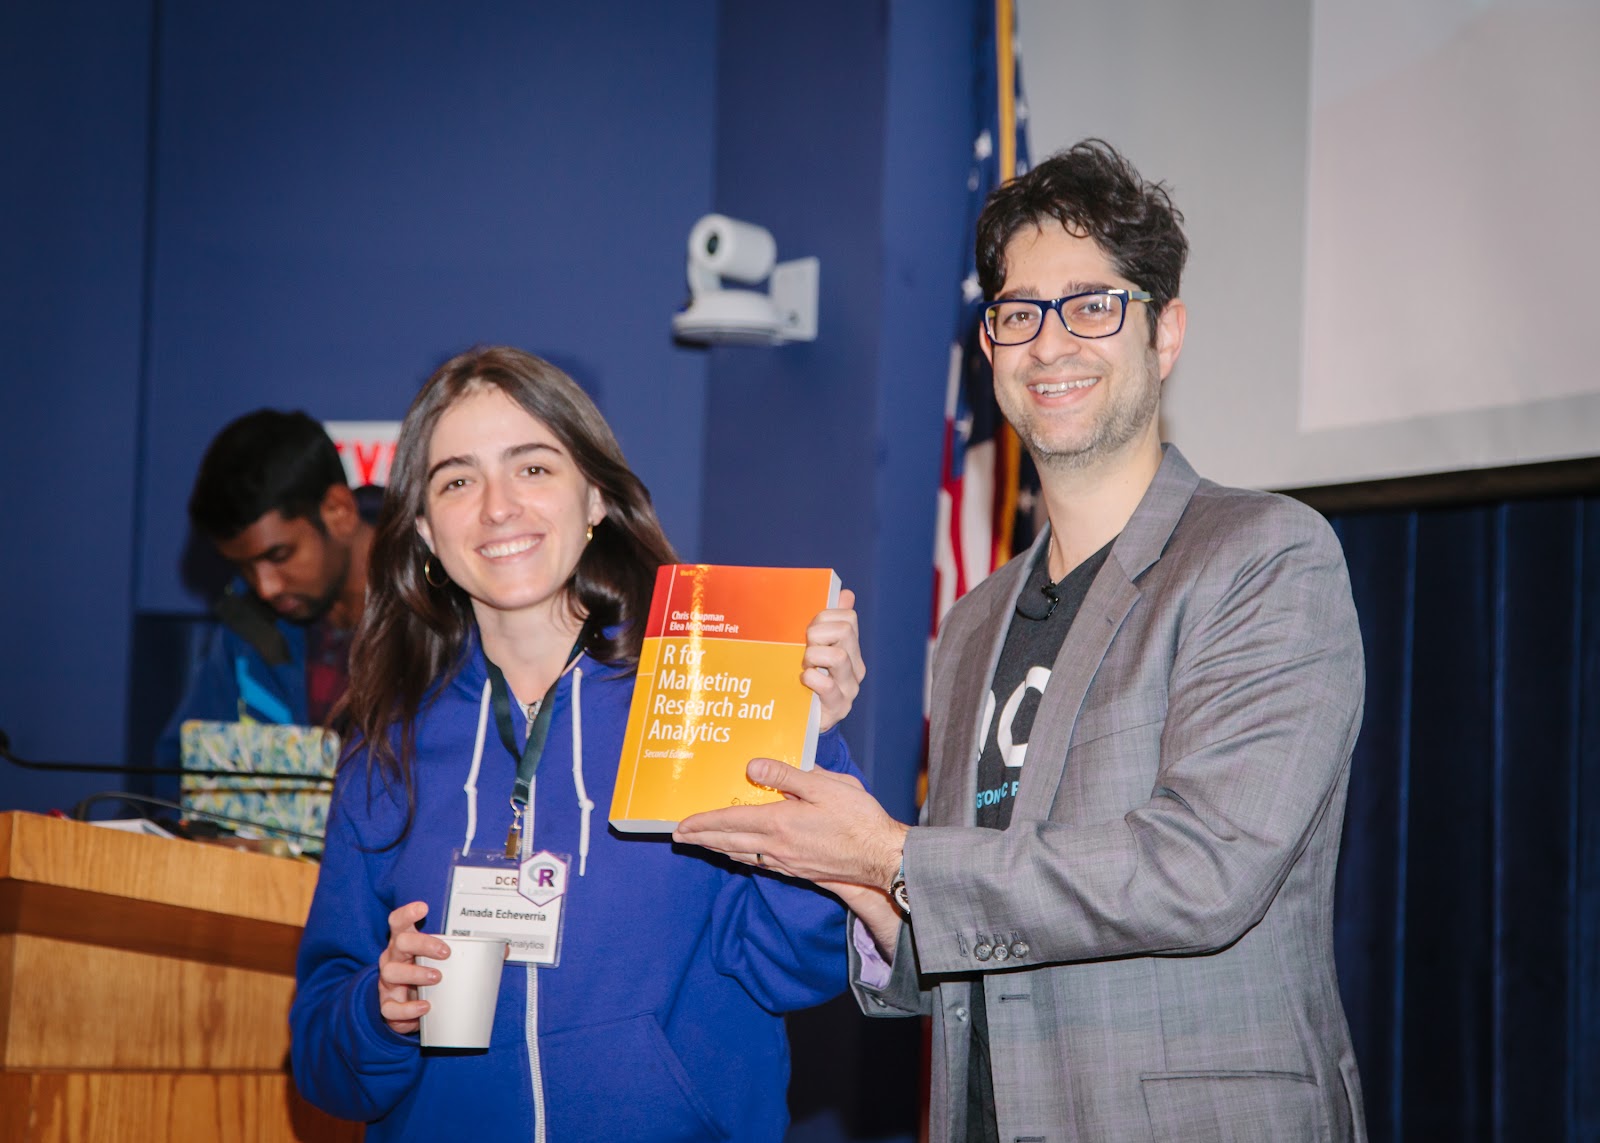
Amada, our Marketing Person, Won an R in Marketing Book
Not to mention we had some great workshops on November 7th, preceding the conference: