After four sold-out years in New York City, the R Conference made its debut in Washington DC to a sold-out crowd of data scientists at the Ronald Reagan Building on November 8th & 9th. Our speakers shared presentations on a variety of R-related topics.
A big thank you to our speakers Max Kuhn, Emily Robinson, Mike Powell, Mara Averick, Max Richman, Stephanie Hicks, Michael Garris, Kelly O’Briant, David Smith, Anna Kirchner, Roger Peng, Marck Vaisman, Soumya Kalra, Jonathan Hersh, Vivian Peng, Dan Chen, Catherine Zhou, Jim Klucar, Lizzy Huang, Refael Lav, Ami Gates, Abhijit Dasgupta, Angela Li and Tommy Jones.
Some highlights from the conference:
R Superstars Mara Averick, Roger Peng and Emily Robinson
A hallmark of our R conferences is that the speakers hang out with all the attendees and these three were crowd favorites.
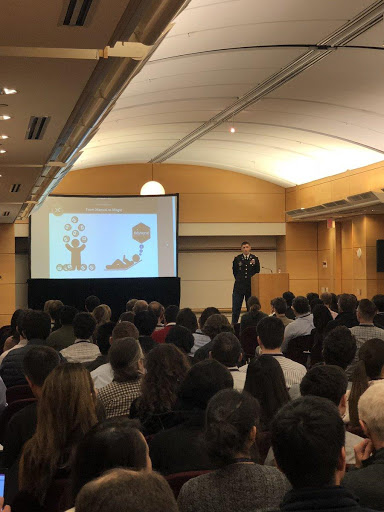
Michael Powell Brings R to the aRmy
Major Michael Powell describes how R has brought efficiency to the Army Intelligence and Security Command by getting analysts out of Excel and into the Tidyverse. “Let me turn those 8 hours into 8 seconds for you,” says Powell.
Max Kuhn Explains the Applications of Equivocals to Apply Levels of Certainty to Predictions
After autographing his book, Applied Predictive Modeling, for a lucky attendee, Max Kuhn explains how Equivocals can be applied to individual predictions in order to avoid reporting predictions when there is significant uncertainty.
NYR and DCR Speaker Emily Robinson Getting an NYR Hoodie for her Awesome Tweeting
Emily Robinson tweeted the most at the 2018 NYR conference, winning her a WASD mechanical keyboard and at DCR she came in second so we gave her a limited edition NYR hoodie.
Max Richman Shows How SQL and R can Co-Exist
Max Richman, wearing the same shirt he wore when he spoke at the first NYR, shows parallels between dplyr and SQL.
Michael Garris Tells the Story of the MNIST Dataset
Michael Garris was a member of the team that built the original MNIST dataset, which set the standard for handwriting image classification in the early 1990s. This talk may have been the first time the origin story was ever told.
R Stats Luminary Roger Peng Explains Relationship Between Air Pollution and Public Health
Roger Peng shows us how air pollution levels has fallen over the past 50 years resulting in dramatic improvements in air quality and health (with help from R).
Kelly O’Briant Combining R with Serverless Computing
Kelly O’Briant demonstrates how to easily deploy R projects on Google Compute Engine and promoted the new #radmins hashtag.
Hot Dog vs Not Hot Dog by David Smith (Inspired by Jian-Yang from HBO’s Silicon Valley)
David Smith, one of the original R users, shows how to recreate HBO’s Silicon Valley’s Not Hot Dog app using R and Azure
Jon Hersh Describes How to Push for Data Science Within Your Organization
Jon Hersh discusses the challenges, and solutions, of getting organizations to embrace data science.
Vivian Peng and the Importance of Data Storytelling
Vivian Peng asks the question, how do we protect the integrity of our data analysis when it’s published for the world to see?
Dan Chen Signs His Book for David Smith
Dan Chen autographing a copy of his book, Pandas for Everyone, for David Smith. Now David Smith has to sign his book, An Introduction to R, for Dan.
Malorie Hughes Analyzing Tweets
On the first day I challenged the audience to analyze the tweets from the conference and Malorie Hughes, a data scientist with NPR, designed a Twitter analytics dashboard to track the attendee with the most tweets with the hashtag #rstatsdc. Seth Wenchel won a WASD keyboard for the best tweeting. And we presented Malorie wit a DCR speaker mug.
Strong Showing from the #RLadies!
The #rladies group is growing year after year and it is great seeing them in force at NYR and DCR!
Packages
Matthew Hendrickson, a DCR attendee, posted on twitter every package mentioned during the two-day conference: tidyverse, tidycensus, leaflet, leaflet.extras, funneljoin, glmnet, xgboost, rstan, rstanarm, LowRankQP, dplyr, coefplot, bayesplot, keras, tensorflow, lars, magrittr, purrr, rsample, useful, knitr, rmarkdown, ggplot2, ggiraph, ggrepel, ggraph, ggthemes, gganimate, ggmap, plotROC, ggridges, gtrendsr, tlnise, tm, Bioconductor, plyranges, sf, tmap, textmineR, tidytext, gmailr, rtweet, shiny, httr, parsnip, probably, plumber, reprex, crosstalk, arules and arulesviz.
Data Community DC
A special thanks to the Data Community DC for helping us make the DC R Conference an incredible experience.
Videos
The videos for the conference will be posted in the coming weeks to dc.rstats.ai.
See You Next Year
Looking forward to more great conferences at next year’s NYR and DCR!

Jared Lander is the Chief Data Scientist of Lander Analytics a New York data science firm, Adjunct Professor at Columbia University, Organizer of the New York Open Statistical Programming meetup and the New York and Washington DC R Conferences and author of R for Everyone.


Hi Jared,
For the videos @ https://dc.rstats.ai/2018/, are those for the NY conf? If so, can we still expect to see the DC vids later? Looking forward to them.
Thanks
We’ll be posting them within the next week.