plot of chunk plot-play-by-down

Continuing with the newly available football data (new link) and inspired by a question from Drew Conway I decided to look at play selection based on down by the Giants for the past 10 years.

Visually, we see that until 2011 the Giants preferred to run on first and second down.  Third down is usually a do-or-die down so passes will dominate on third-and-long.  The grey vertical lines mark Super Bowls XLII and XLVI.

Code for the graph after the break.

Continue reading

Related Posts


Jared Lander is the Chief Data Scientist of Lander Analytics a New York data science firm, Adjunct Professor at Columbia University, Organizer of the New York Open Statistical Programming meetup and the New York and Washington DC R Conferences and author of R for Everyone.

Class Photo

About a month ago we had our final Data Science class of the semester.  We took a great class photo that I meant to share then but am just getting to it now.

I also snapped a great shot of Adam Obeng in front of an NYC Data Mafia slide during his class presentation.

NYC Data Mafia Slide

Related Posts


Jared Lander is the Chief Data Scientist of Lander Analytics a New York data science firm, Adjunct Professor at Columbia University, Organizer of the New York Open Statistical Programming meetup and the New York and Washington DC R Conferences and author of R for Everyone.

plot of chunk make-graph

With the recent availability (new link) of play-by-play NFL data I got to analyzing my favorite team, the New York Giants with some very hasty EDA.

From the above graph you can see that on 1st down Eli preferred to throw to Hakim Nicks and on 2nd and 3rd downs he slightly favored Victor Cruz.

The code for the analysis is after the break.

Continue reading

Related Posts


Jared Lander is the Chief Data Scientist of Lander Analytics a New York data science firm, Adjunct Professor at Columbia University, Organizer of the New York Open Statistical Programming meetup and the New York and Washington DC R Conferences and author of R for Everyone.




How was Mama’s Too?

  • Good (54%, 7 Votes)
  • Average (23%, 3 Votes)
  • Excellent (15%, 2 Votes)
  • Poor (8%, 1 Votes)
  • Never Again (0%, 0 Votes)

Total Voters: 13

Loading ... Loading …

Aggregated results.

Results from individual previous polls are below. Continue reading

Related Posts


Jared Lander is the Chief Data Scientist of Lander Analytics a New York data science firm, Adjunct Professor at Columbia University, Organizer of the New York Open Statistical Programming meetup and the New York and Washington DC R Conferences and author of R for Everyone.

A friend of mine has told me on numerous occasions that since 1960 the Yankees have not won a World Series while a Republican was President.  Upon hearing this my Republican friends (both Yankee and Red Sox fans) turn incredulous and say that this is ridiculous.  So I decided to investigate.  To be clear this is in no way shows causality, but just checks the numbers.

The data was easily attainable so it really came down to plotting.

The plot above shows every Yankee win (and loss) since 1960 and the party of the President at the time.  It is clear to see that all nine Yankees World Series wins came while a Democrat inhabited the White House.  The fluctuation plot below shows Yankee wins both before and after 1960 and the complete lack of a block for Republican/Post-1960 simply makes the case.

There are similar plots for the American League after the jump.

Continue reading

Related Posts


Jared Lander is the Chief Data Scientist of Lander Analytics a New York data science firm, Adjunct Professor at Columbia University, Organizer of the New York Open Statistical Programming meetup and the New York and Washington DC R Conferences and author of R for Everyone.

How was Pizza Mercato?

  • Good (46%, 6 Votes)
  • Average (31%, 4 Votes)
  • Never Again (15%, 2 Votes)
  • Poor (8%, 1 Votes)
  • Excellent (0%, 0 Votes)

Total Voters: 13

Loading ... Loading …

Related Posts


Jared Lander is the Chief Data Scientist of Lander Analytics a New York data science firm, Adjunct Professor at Columbia University, Organizer of the New York Open Statistical Programming meetup and the New York and Washington DC R Conferences and author of R for Everyone.

Wes McKinney and I are hosting our first ever Open Statistical Programming meetup tomorrow night after taking over for Drew Conway.  Please attend, have some pizza, enjoy the talk then come out for some beer.

This meetup is about EDA, Visualization and Collaboration on the Web and will be presented by Carlos Scheidegger from AT&T Labs.

This month’s pizza will be from Pizza Mercato in the Village.

Related Posts


Jared Lander is the Chief Data Scientist of Lander Analytics a New York data science firm, Adjunct Professor at Columbia University, Organizer of the New York Open Statistical Programming meetup and the New York and Washington DC R Conferences and author of R for Everyone.

Shortly after the Giants fantastic defeat of the Patriots in Super Bowl XLVI (I was a little disappointed that Eli, Coughlin and the Vince Lombardi Trophy all got off the parade route early and the views of City Hall were obstructed by construction trailers, but Steve Weatherford was awesome as always) a friend asked me to settle a debate amongst some people in a Super Bowl pool.

He writes:

We have 10 participants in a superbowl pool.  The pool is a “pick the player who scores first” type pool.  In a hat, there are 10 Giants players.  Each participant picks 1 player out of the hat (in no particular order) until the hat is emptied.  Then 10 Patriots players go in the hat and each participant picks again.

In the end, each of the 10 participants has 1 Giants player and 1 Patriots player.  No one has any duplicate players as 10 different players from each team were selected.  Pool looks as follows:

Participant 1 Giant A Patriot Q
Participant 2 Giant B Patriot R
Participant 3 Giant C Patriot S
Participant 4 Giant D Patriot T
Participant 5 Giant E Patriot U
Participant 6 Giant F Patriot V
Participant 7 Giant G Patriot W
Participant 8 Giant H Patriot X
Participant 9 Giant I Patriot Y
Participant 10 Giant J Patriot Z

Winners = First Player to score wins half the pot.  First player to score in 2nd half wins the remaining half of the pot.

The question is, what are the odds that someone wins Both the 1st and 2nd half.  Remember, the picks were random.

Before anyone asks about the safety, one of the slots was for Special Teams/Defense.

There are two probabilistic ways of thinking about this.  Both hinge on the fact that whoever scores first in each half is both independent and not mutually exclusive.

First, let’s look at the two halves individually.  In a given half any of 20 players can score first (10 from the Giants and 10 from the Patriots) and an individual participant can win with two of those.  So a participant has a 2/20 = 1/10 chance of winning a half.  Thus that participant has a (1/10) * (1/10) = 1/100 chance of winning both halves.  Since there are 10 participants there is an overall probability of 10 * (1/100) = 1/10 of any single participant winning both halves.

The other way is to think a little more combinatorically.  There are 20 * 20 = 400 different combinations of players scoring first in each half.  A participant has two players which are each valid for each half giving them four of the possible combinations leading to a 4 / 400 = 1/100 probability that a single participant will win both halves.  Again, there are 10 participants giving an overall 10% chance of any one participant winning both halves.

Since both methods agreed I am pretty confidant in the results, but just in case I ran some simulations in R which you can find after the break.

Continue reading

Related Posts


Jared Lander is the Chief Data Scientist of Lander Analytics a New York data science firm, Adjunct Professor at Columbia University, Organizer of the New York Open Statistical Programming meetup and the New York and Washington DC R Conferences and author of R for Everyone.

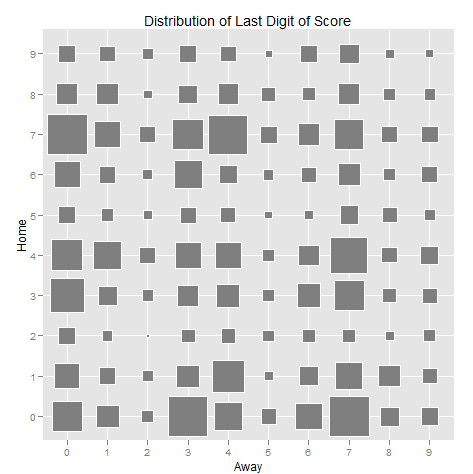
With the Super Bowl only hours away now is your last chance to buy your boxes.  Assuming the last digits are not assigned randomly you can maximize your chances with a little analysis.  While I’ve seen plenty of sites giving the raw numbers, I thought a little visualization was in order.

In the graph above (made using ggplot2 in R, of course) the bigger squares represent greater frequency.  The axes are labelled “Home” and “Away” for orientation, but in the Super Bowl that probably doesn’t matter too much, especially considering that Indianapolis is (Peyton) Manning territory so the locals will most likely be rooting for the Giants.  Further, I believe Super Bowl XLII, featuring the same two teams, had a disproportionate number of Giants fans.  Bias disclaimer:  GO BIG BLUE!!!

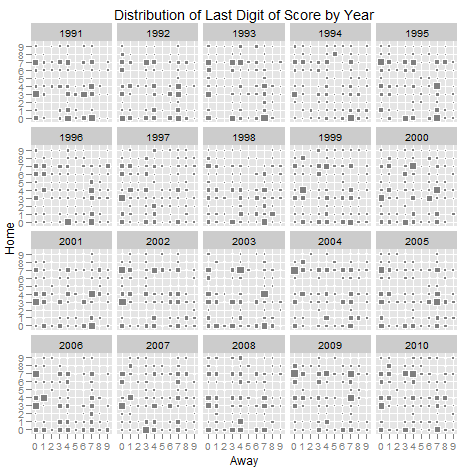
Below is the same graph broken down by year to see how the distribution has changed over the past 20 years.

All the data was scraped from Pro Football Reference.  All of my code and other graphs that didn’t make the cut are at my github site.

As always, send any questions my way.

Related Posts


Jared Lander is the Chief Data Scientist of Lander Analytics a New York data science firm, Adjunct Professor at Columbia University, Organizer of the New York Open Statistical Programming meetup and the New York and Washington DC R Conferences and author of R for Everyone.

Pi Day Celebrants

As mentioned earlier, yesterday was Pi Day so a bunch of statisticians and other such nerds celebrated at the new(ish) Artichoke Basille near the High Line.  We had three pies:  the signature Artichoke, the Margherita and the Anchovy, which was delicious but only some of us ate.  And of course we had our custom cake from Chrissie Cook.

The photos were taken by John.

Pi Cake 2011
NYC Data Mafia
NYC Data Mafia

Related Posts


Jared Lander is the Chief Data Scientist of Lander Analytics a New York data science firm, Adjunct Professor at Columbia University, Organizer of the New York Open Statistical Programming meetup and the New York and Washington DC R Conferences and author of R for Everyone.