A friend of mine has told me on numerous occasions that since 1960 the Yankees have not won a World Series while a Republican was President.  Upon hearing this my Republican friends (both Yankee and Red Sox fans) turn incredulous and say that this is ridiculous.  So I decided to investigate.  To be clear this is in no way shows causality, but just checks the numbers.

The data was easily attainable so it really came down to plotting.

The plot above shows every Yankee win (and loss) since 1960 and the party of the President at the time.  It is clear to see that all nine Yankees World Series wins came while a Democrat inhabited the White House.  The fluctuation plot below shows Yankee wins both before and after 1960 and the complete lack of a block for Republican/Post-1960 simply makes the case.

There are similar plots for the American League after the jump.

Continue reading

Related Posts


Jared Lander is the Chief Data Scientist of Lander Analytics a New York data science firm, Adjunct Professor at Columbia University, Organizer of the New York Open Statistical Programming meetup and the New York and Washington DC R Conferences and author of R for Everyone.

How was Pizza Mercato?

  • Good (46%, 6 Votes)
  • Average (31%, 4 Votes)
  • Never Again (15%, 2 Votes)
  • Poor (8%, 1 Votes)
  • Excellent (0%, 0 Votes)

Total Voters: 13

Loading ... Loading …

Related Posts


Jared Lander is the Chief Data Scientist of Lander Analytics a New York data science firm, Adjunct Professor at Columbia University, Organizer of the New York Open Statistical Programming meetup and the New York and Washington DC R Conferences and author of R for Everyone.

Wes McKinney and I are hosting our first ever Open Statistical Programming meetup tomorrow night after taking over for Drew Conway.  Please attend, have some pizza, enjoy the talk then come out for some beer.

This meetup is about EDA, Visualization and Collaboration on the Web and will be presented by Carlos Scheidegger from AT&T Labs.

This month’s pizza will be from Pizza Mercato in the Village.

Related Posts


Jared Lander is the Chief Data Scientist of Lander Analytics a New York data science firm, Adjunct Professor at Columbia University, Organizer of the New York Open Statistical Programming meetup and the New York and Washington DC R Conferences and author of R for Everyone.

Shortly after the Giants fantastic defeat of the Patriots in Super Bowl XLVI (I was a little disappointed that Eli, Coughlin and the Vince Lombardi Trophy all got off the parade route early and the views of City Hall were obstructed by construction trailers, but Steve Weatherford was awesome as always) a friend asked me to settle a debate amongst some people in a Super Bowl pool.

He writes:

We have 10 participants in a superbowl pool.  The pool is a “pick the player who scores first” type pool.  In a hat, there are 10 Giants players.  Each participant picks 1 player out of the hat (in no particular order) until the hat is emptied.  Then 10 Patriots players go in the hat and each participant picks again.

In the end, each of the 10 participants has 1 Giants player and 1 Patriots player.  No one has any duplicate players as 10 different players from each team were selected.  Pool looks as follows:

Participant 1 Giant A Patriot Q
Participant 2 Giant B Patriot R
Participant 3 Giant C Patriot S
Participant 4 Giant D Patriot T
Participant 5 Giant E Patriot U
Participant 6 Giant F Patriot V
Participant 7 Giant G Patriot W
Participant 8 Giant H Patriot X
Participant 9 Giant I Patriot Y
Participant 10 Giant J Patriot Z

Winners = First Player to score wins half the pot.  First player to score in 2nd half wins the remaining half of the pot.

The question is, what are the odds that someone wins Both the 1st and 2nd half.  Remember, the picks were random.

Before anyone asks about the safety, one of the slots was for Special Teams/Defense.

There are two probabilistic ways of thinking about this.  Both hinge on the fact that whoever scores first in each half is both independent and not mutually exclusive.

First, let’s look at the two halves individually.  In a given half any of 20 players can score first (10 from the Giants and 10 from the Patriots) and an individual participant can win with two of those.  So a participant has a 2/20 = 1/10 chance of winning a half.  Thus that participant has a (1/10) * (1/10) = 1/100 chance of winning both halves.  Since there are 10 participants there is an overall probability of 10 * (1/100) = 1/10 of any single participant winning both halves.

The other way is to think a little more combinatorically.  There are 20 * 20 = 400 different combinations of players scoring first in each half.  A participant has two players which are each valid for each half giving them four of the possible combinations leading to a 4 / 400 = 1/100 probability that a single participant will win both halves.  Again, there are 10 participants giving an overall 10% chance of any one participant winning both halves.

Since both methods agreed I am pretty confidant in the results, but just in case I ran some simulations in R which you can find after the break.

Continue reading

Related Posts


Jared Lander is the Chief Data Scientist of Lander Analytics a New York data science firm, Adjunct Professor at Columbia University, Organizer of the New York Open Statistical Programming meetup and the New York and Washington DC R Conferences and author of R for Everyone.

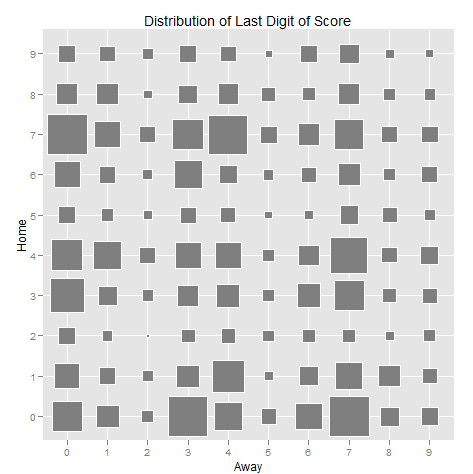
With the Super Bowl only hours away now is your last chance to buy your boxes.  Assuming the last digits are not assigned randomly you can maximize your chances with a little analysis.  While I’ve seen plenty of sites giving the raw numbers, I thought a little visualization was in order.

In the graph above (made using ggplot2 in R, of course) the bigger squares represent greater frequency.  The axes are labelled “Home” and “Away” for orientation, but in the Super Bowl that probably doesn’t matter too much, especially considering that Indianapolis is (Peyton) Manning territory so the locals will most likely be rooting for the Giants.  Further, I believe Super Bowl XLII, featuring the same two teams, had a disproportionate number of Giants fans.  Bias disclaimer:  GO BIG BLUE!!!

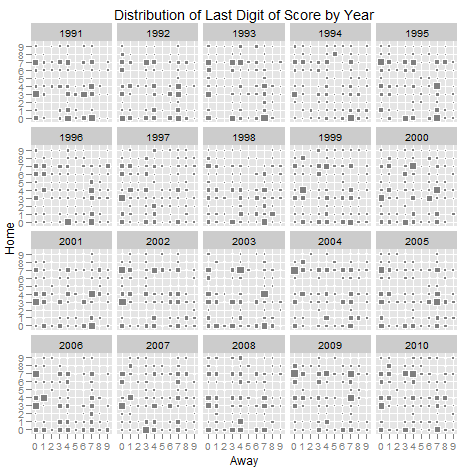
Below is the same graph broken down by year to see how the distribution has changed over the past 20 years.

All the data was scraped from Pro Football Reference.  All of my code and other graphs that didn’t make the cut are at my github site.

As always, send any questions my way.

Related Posts


Jared Lander is the Chief Data Scientist of Lander Analytics a New York data science firm, Adjunct Professor at Columbia University, Organizer of the New York Open Statistical Programming meetup and the New York and Washington DC R Conferences and author of R for Everyone.

Pi Day Celebrants

As mentioned earlier, yesterday was Pi Day so a bunch of statisticians and other such nerds celebrated at the new(ish) Artichoke Basille near the High Line.  We had three pies:  the signature Artichoke, the Margherita and the Anchovy, which was delicious but only some of us ate.  And of course we had our custom cake from Chrissie Cook.

The photos were taken by John.

Pi Cake 2011
NYC Data Mafia
NYC Data Mafia

Related Posts


Jared Lander is the Chief Data Scientist of Lander Analytics a New York data science firm, Adjunct Professor at Columbia University, Organizer of the New York Open Statistical Programming meetup and the New York and Washington DC R Conferences and author of R for Everyone.
Supreme Court Justice Antonin ScaliaDaily Intel caught wind of a California Lawyer interview with US Supreme Court Justice Antonin Scalia where he proclaims New York pizza “is infinitely better than Washington pizza, and infinitely better than Chicago pizza.”  I may be biased to New York pizza as well, but that is a debate I’ll save for another day.

It gets really interesting when he says, “You know these deep-dish pizzas—it’s not pizza. It’s very good, but … call it tomato pie or something.”  While an argument can certainly me made that deep-dish pizza is almost a casserole, I think the folks down in Trenton (where Scalia was born) have already claimed the name tomato pie, referring to a round pie with the sauce on top.

Hopefully Slice will chime in on this.

Related Posts


Jared Lander is the Chief Data Scientist of Lander Analytics a New York data science firm, Adjunct Professor at Columbia University, Organizer of the New York Open Statistical Programming meetup and the New York and Washington DC R Conferences and author of R for Everyone.
As many people are aware two nights ago was a total lunar eclipse that occured on the winter solstice, a pretty rare combination.  I won’t go into the math behind the eclipse or the solstice or discuss the rarity or physics of the event.  I just want to show off these great pictures.  Early Tuesday morning my friend John (who is not a professional photographer) and I climbed up to the roof of my building with his pro camera and gear armed only with many layers of Under Armour and North Face and hot chocolate.

We took probably a hundred pictures, but these are the two he sent me.  They were taken with a high end Canon DSLR with a powerful telephoto lens and a tripod.  I’m not certain of the specifics, but we used a middle-sized aperture setting and long exposures, ranging from 4 to 30 seconds.  Next up I want to mount this thing to a telescope.

He also took a bunch of pictures on a behind-the-scenes tour of Grand Central that I find breathtaking.

One more pic after the break. Continue reading

Related Posts


Jared Lander is the Chief Data Scientist of Lander Analytics a New York data science firm, Adjunct Professor at Columbia University, Organizer of the New York Open Statistical Programming meetup and the New York and Washington DC R Conferences and author of R for Everyone.

For the past few weeks Time Out New York‘s Dating columnist, Jamie Bufalino, has been fielding letters discussing the ratio of homosexual to heterosexual questions he answers.  The readers suggested that disproportionate attention is paid to Gay and Lesbian issues compared to the Gay and Lesbian proportion of the general population.      

Jamie rudely called his readers “ass-wipes” and repeatedly told them to “remove your head from your ass.”  He also professed to have “no idea what the percentage is of gay/bi versus straight issues that end up in the column.”  

One question and response:  

Q I see statistics that show NYC to be 6 percent gay, lesbian and bi, and yet in “Get Naked” you feature letters from them almost to the exclusion of heteros. Why the preoccupation with them in your column? It doesn’t seem right or logical. As one of the other 94 percent, I am disappointed and offended weekly.   

A All I can say is: You’ve got your head up your butt. Just in the past month or so, I’ve answered letters from a straight guy with a weird fetish that suddenly stopped delivering the jollies it used to, a straight guy who was juggling a woman from the Ukraine and a woman from Jersey, a woman who had an issue with sticking her finger up her boyfriend’s butt, a 19-year-old woman who was getting pressured to have sex with her boyfriend, and on and on. If, for some reason, you happen to be obsessing over the gay and bi questions and not acknowledging the straight ones, that’s your issue, not mine.  

And another:  

Q I always read your column to see if I can learn something and just for shits and giggles. The one thing that has always bothered me is your preoccupation with gay and bi problems. Gays and lesbians get their own special section of three to four pages!  

A First of all, dude, you sound like one of those total ass-wipes who believes that gay people somehow have all these special privileges that straight people aren’t entitled to. Honestly, I have no idea what the percentage is of gay/bi versus straight issues that end up in the column, because it doesn’t matter. If you removed your head from your ass, you’d realize that so many sexual issues are universal and that you can learn something from all sorts of people who don’t fit into your specific demographic.  

When confronted with the data he once again reffered to a “head lodged up [a] rectum” and suggested the reader was “paranoid.”  

Q As a statistician I am disappointed by your response to a question in the November 4 issue [TONY 788]. The reader wrote, “I see statistics that show NYC to be 6 percent gay, lesbian and bi, and yet in ‘Get Naked’ you feature letters from them almost to the exclusion of heteros. Why the preoccupation with them in your column? … As one of the other 94 percent, I am disappointed and offended weekly.” You responded by citing individual examples of heterosexual questions you’ve fielded, which is not a valid form of proof. I went through about ten months’ worth of “Get Naked” columns on the TONY website and found that approximately 19 percent of the questions were from gay (15 percent) or lesbian (4 percent) readers. Whether or not that percentage is representative of the general population is not my concern. I just feel that Jamie should have his data correct and not write, “You’ve got your head up your butt.”  

A I seriously cannot believe I am still getting letters about this. Okay, Mr. Disappointed Statistician: If you don’t want to come off as someone who has his head lodged up his rectum, it would be an awesome idea not to leap to the defense of some jackass who claims I cater to homo letters “almost to the exclusion of heteros” and then point out that straight issues actually make up a full 81 percent of the subject matter here in “Get Naked.” What I want to know is, why are you even keeping score? Are you really that insecure about the amount of attention heterosexual sex gets in the media? If so, that’s both laughable and sad. This is the last time I’m addressing this, so here’s my final bit of advice to you (and your like-minded brethren): Stop being so paranoid.  

Since Jamie is so rude to his readers and clearly doesn’t have any sense of the data, I thought I’d take a look at the numbers.  Results after the break.   

Continue reading

Related Posts


Jared Lander is the Chief Data Scientist of Lander Analytics a New York data science firm, Adjunct Professor at Columbia University, Organizer of the New York Open Statistical Programming meetup and the New York and Washington DC R Conferences and author of R for Everyone.

Ed Tufte
Ed Tufte

The other week I finally made it to the Ed Tufte exhibit in Chelsea.  The gallery is a collection of his art and not about data, though as he tells it data is not important, but information is and that his art conveys information of all kinds.  Going on a Saturday means you’ll get a tour from the artist himself.  Getting to hear him describe his art and the way the eye and mind see it is really fascinating.

We had a chance to briefly chat about data (how could I resist) and he reinforced the notion that the medium, or the code or graphics, don’t matter.  He “would use sock puppets to get his point across” if that was necessary.  Something that al data visualists should keep in mind.

The day was even more exciting for me because he autographed my copy of Envisioning Information and I became mayor of the gallery on Foursquare.

Related Posts


Jared Lander is the Chief Data Scientist of Lander Analytics a New York data science firm, Adjunct Professor at Columbia University, Organizer of the New York Open Statistical Programming meetup and the New York and Washington DC R Conferences and author of R for Everyone.